North Richland Hills: Fire Incidents, Texas (TX)
Where are fire incidents reported in North Richland Hills, TX
Something went wrong! Please refresh the page.
| Fire incidents reported | |
|---|---|
| Sreet name | Count |
| GLENVIEW DR | 226 |
| BOULEVARD 26 | 220 |
| RUFE SNOW DR | 202 |
| HARWOOD RD | 182 |
| DAVIS | 96 |
| DAVIS BLVD | 94 |
| MUTUAL AID-NORTH RICHLAND | 76 |
| LOOP 820 FWY | 64 |
| WEYLAND DR | 64 |
| LOOP 820 WBA FWY | 56 |
| GRAPEVINE HWY | 52 |
| HOLIDAY LN | 50 |
| ONYX DR | 48 |
| DOUGLAS LN | 44 |
| HIGHTOWER DR | 44 |
| SMITHFIELD RD | 44 |
| EMERALD HILLS WAY | 42 |
| MEADOWCREST DR | 42 |
| STARNES RD | 42 |
| GLENVIEW CT | 40 |
| LOOP 820 | 38 |
| MID CITIES | 38 |
| COLLEGE CIRCLE | 36 |
| BUENOS AIRES DR | 32 |
| PRECINCT LINE RD | 32 |
| BROWNING DR | 30 |
| CHAPMAN RD | 30 |
| MAPLEWOOD AVE | 30 |
| IRON HORSE BLVD | 28 |
| LOOP 820 EBA FWY | 28 |
| Other | 417 |
2003 - 2018 National Fire Incident Reporting System (NFIRS) incidents
- Incident types reported to NFIRS in North Richland Hills, TX
- 20,30261.5%Rescue & EMS
- 3,46210.5%Hazardous Condition
- 3,1029.4%Service Call
- 2,4677.5%Fire
- 1,6755.1%False Alarm
- 1,5424.7%Good Intent Call
- 4121.2%Special Incident
- 410.1%Overpressure Rupture
- Fire incident types reported to NFIRS in North Richland Hills, TX
- 1,03642.0%Structure Fires
- 90536.7%Outside Fires
- 35814.5%Mobile Property/Vehicle Fires
- 1686.8%Other
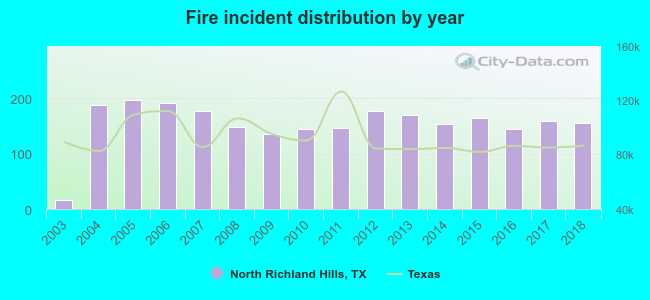 According to the data from the years 2003 - 2018 the average number of fires per year is 154. The highest number of reported fires - 196 took place in 2005, and the least - 17 in 2003. The data has a growing trend.
The average number of yearly fire incidents per 10k residents in North Richland Hills, TX compared to nearest cities:
(Note: Based on data for the last 3 years, including only cities with population 5,000 and above)
| North Richland Hills: | 22.3 |
| Watauga: | 29.2 |
| Hurst: | 28.8 |
| Richland Hills: | 17.8 |
| Haltom City: | 42.3 |
| Colleyville: | 22.2 |
| Bedford: | 29.2 |
| Keller: | 24.5 |
| Euless: | 29.7 |
 The median response time based on all reported fire incidents is 6 minutes. This is about the same as the state median value.
The median response time in North Richland Hills, TX compared to nearest cities:
(Note: Based on data for all years, including only cities with at least 500 fire incidents)
| North Richland Hills: | 6 minutes |
| Watauga: | 6 minutes |
| Hurst: | 5 minutes |
| Richland Hills: | 5 minutes |
| Haltom City: | 5 minutes |
| Colleyville: | 7 minutes |
| Bedford: | 4 minutes |
| Keller: | 6 minutes |
| Euless: | 5 minutes |
 According to the reports from the years 2003 - 2018 the average number of fire-related yearly casualties is 4. The highest number of reported injuries - 9 took place in 2004, and the lowest - 0 in 2003. The data has an increasing trend.
The average number of injuries per 1,000 fires is 21. This indicator was the highest - 48 in 2004, and the lowest 0 in 2003. The trend for casualties per 1,000 fire incidents is increasing. Compared to the Texas value the number of casualties per 1,000 fire incidents is much higher.
According to the reports from the years 2003 - 2018 the average number of fire-related yearly casualties is 4. The highest number of reported injuries - 9 took place in 2004, and the lowest - 0 in 2003. The data has an increasing trend.
The average number of injuries per 1,000 fires is 21. This indicator was the highest - 48 in 2004, and the lowest 0 in 2003. The trend for casualties per 1,000 fire incidents is increasing. Compared to the Texas value the number of casualties per 1,000 fire incidents is much higher.Casualties per 1,000 incidents in North Richland Hills, TX compared to nearest cities:
(Note: Based on data for all years, including only cities with at least 500 fire incidents)
| North Richland Hills: | 23.5 |
| Watauga: | 3.6 |
| Hurst: | 8.2 |
| Richland Hills: | 9.8 |
| Haltom City: | 6.0 |
| Colleyville: | 2.2 |
| Bedford: | 30.9 |
| Keller: | 17.7 |
| Euless: | 35.9 |
 29.3% incidents where reported in the morning and 70.7% in the evening. The most fires (16.4%) took place on Saturday, and the least (13.0%) on Thursday.
 According to the 2,467 fire incidents from years 2003 - 2018 most fires (11.3%) took place during January, and the least (6.1%) in November.
 Out of all 33,016 cases reported during the years 2003 - 2018, the most belonged to the categories: Rescue & EMS (61.5%), Hazardous Condition (10.5%), and Service Call (9.4%).
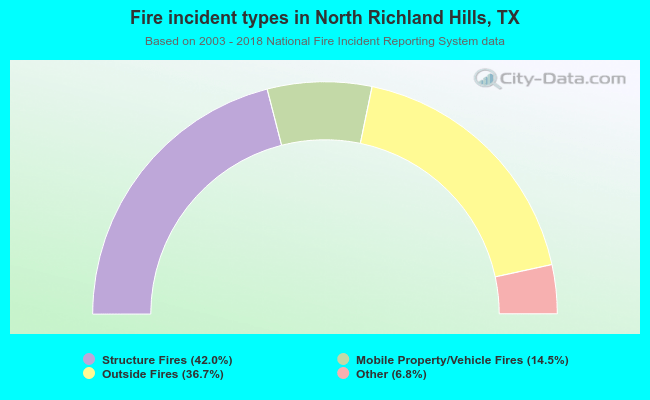 When looking into fire subcategories, the most incidents belonged to: Structure Fires (42.0%), and Outside Fires (36.7%).