Kenmore: Fire Incidents, Washington (WA)
Where are fire incidents reported in Kenmore, WA
Something went wrong! Please refresh the page.
| Fire incidents reported | |
|---|---|
| Sreet name | Count |
| BOTHELL WAY | 180 |
| 175TH ST | 110 |
| 73RD AVE | 64 |
| 68TH AVE | 50 |
| 181ST ST | 48 |
| 182ND ST | 48 |
| 71ST AVE | 40 |
| 80TH AVE | 34 |
| SIMONDS RD | 34 |
| JUANITA DR | 32 |
| 83RD PL | 24 |
| 66TH AVE | 22 |
| 75TH AVE | 22 |
| 81ST AVE | 20 |
| 61ST AVE | 18 |
| 84TH AVE | 18 |
| 155TH ST | 16 |
| 170TH ST | 16 |
| 65TH AVE | 16 |
| INGLEWOOD RD | 16 |
| 62ND AVE | 14 |
| 70TH AVE | 14 |
| 153RD PL | 12 |
| 190TH ST | 12 |
| 150TH ST | 10 |
| 195TH ST | 10 |
| 72ND AVE | 10 |
| 76TH AVE | 10 |
| ARROWHEAD DR | 10 |
| 151ST ST | 8 |
2002 - 2018 National Fire Incident Reporting System (NFIRS) incidents
- Incident types reported to NFIRS in Kenmore, WA
- 7,20369.3%Rescue & EMS
- 7667.4%Good Intent Call
- 6746.5%Fire
- 5495.3%False Alarm
- 5465.3%Service Call
- 5275.1%Hazardous Condition
- 1131.1%Special Incident
- 170.2%Overpressure Rupture
- Fire incident types reported to NFIRS in Kenmore, WA
- 34350.9%Structure Fires
- 19528.9%Outside Fires
- 7210.7%Mobile Property/Vehicle Fires
- 649.5%Other
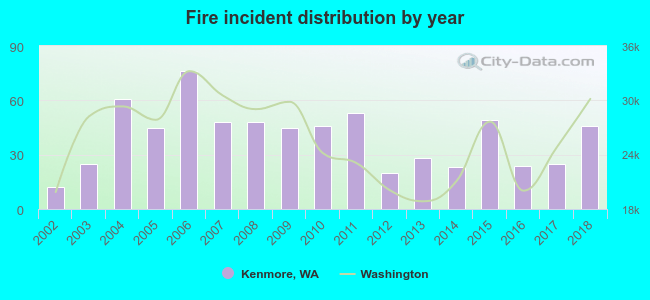 According to the data from the years 2002 - 2018 the average number of fires per year is 40. The highest number of fire incidents - 76 took place in 2006, and the least - 12 in 2002. The data has a growing trend.
The average number of yearly fire incidents per 10k residents in Kenmore, WA compared to nearest cities:
(Note: Based on data for the last 3 years, including only cities with population 5,000 and above)
| Kenmore: | 14.5 |
| Lake Forest Park: | 12.6 |
| Bothell: | 32.5 |
| Brier: | 10.4 |
| Mountlake Terrace: | 14.9 |
| Woodinville: | 16.1 |
| Shoreline: | 23.4 |
| Kirkland: | 6.4 |
| Lynnwood: | 56.1 |
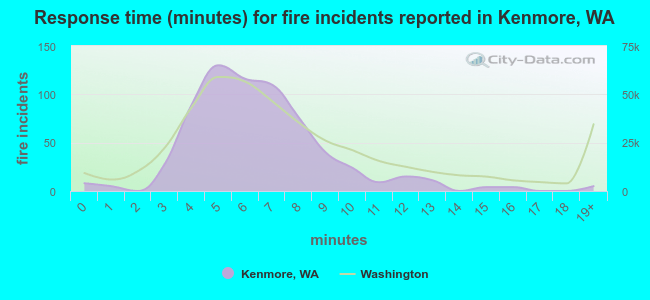 The median response time based on all reported fire incidents is 6 minutes. This is about the same as the Washington median value.
The median response time in Kenmore, WA compared to nearest cities:
(Note: Based on data for all years, including only cities with at least 500 fire incidents)
| Kenmore: | 6 minutes |
| Bothell: | 6 minutes |
| Mountlake Terrace: | 7 minutes |
| Woodinville: | 7 minutes |
| Shoreline: | 7 minutes |
| Kirkland: | 6 minutes |
| Lynnwood: | 7 minutes |
| Edmonds: | 7 minutes |
| Redmond: | 6 minutes |
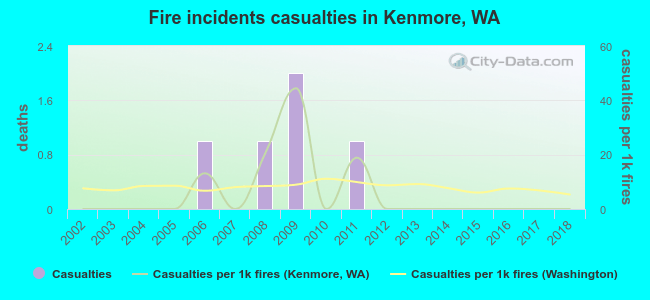 According to the data from the years 2002 - 2018 the average number of fire-related yearly casualties is 0. The highest number of reported casualties - 2 took place in 2009, and the lowest - 0 in 2002. The data has a constant trend.
The average number of casualties per 1,000 fires is 6. This indicator was the highest - 44 in 2009, and the lowest 0 in 2002. The trend for injuries per 1,000 fire incidents is constant. Compared to the state value the number of casualties per 1,000 fires is about the same.
According to the data from the years 2002 - 2018 the average number of fire-related yearly casualties is 0. The highest number of reported casualties - 2 took place in 2009, and the lowest - 0 in 2002. The data has a constant trend.
The average number of casualties per 1,000 fires is 6. This indicator was the highest - 44 in 2009, and the lowest 0 in 2002. The trend for injuries per 1,000 fire incidents is constant. Compared to the state value the number of casualties per 1,000 fires is about the same.Casualties per 1,000 incidents in Kenmore, WA compared to nearest cities:
(Note: Based on data for all years, including only cities with at least 500 fire incidents)
| Kenmore: | 7.4 |
| Bothell: | 10.0 |
| Mountlake Terrace: | 13.9 |
| Woodinville: | 3.3 |
| Shoreline: | 19.2 |
| Kirkland: | 2.5 |
| Lynnwood: | 7.8 |
| Edmonds: | 13.1 |
| Redmond: | 7.6 |
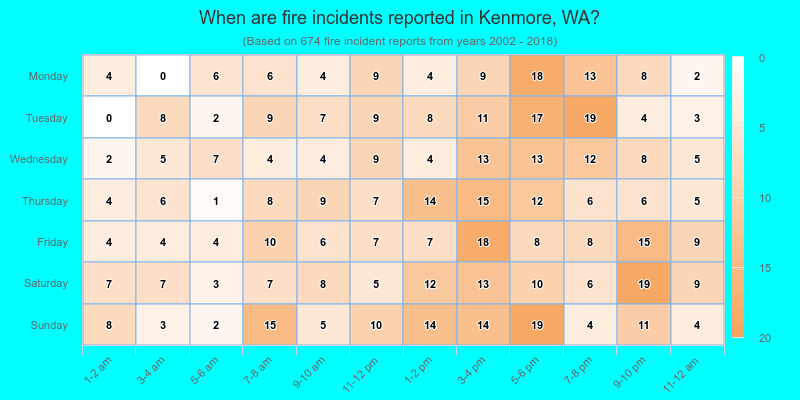
 36.4% incidents where reported in the morning and 63.6% in the evening. The most fires (16.2%) took place on Sunday, and the least (12.3%) on Monday.
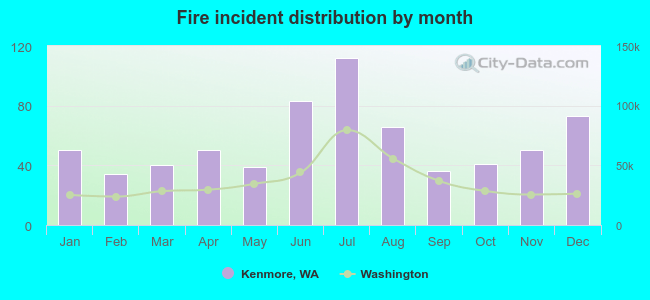 According to the 674 fires from years 2002 - 2018 most fires (16.6%) took place during July, and the least (5.0%) in February.
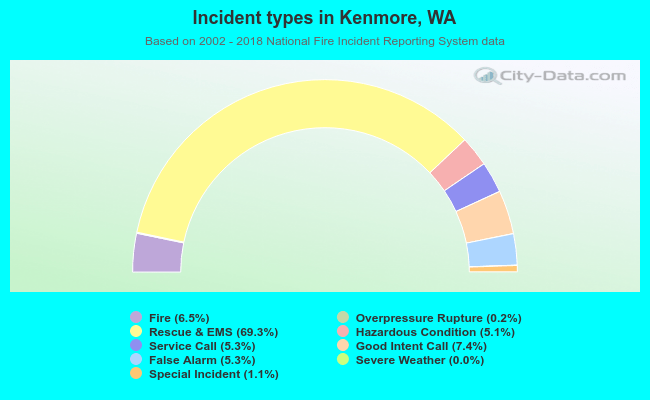 Out of all 10,398 cases reported during the years 2002 - 2018, the most belonged to the categories: Rescue & EMS (69.3%), Good Intent Call (7.4%), and Fire (6.5%).
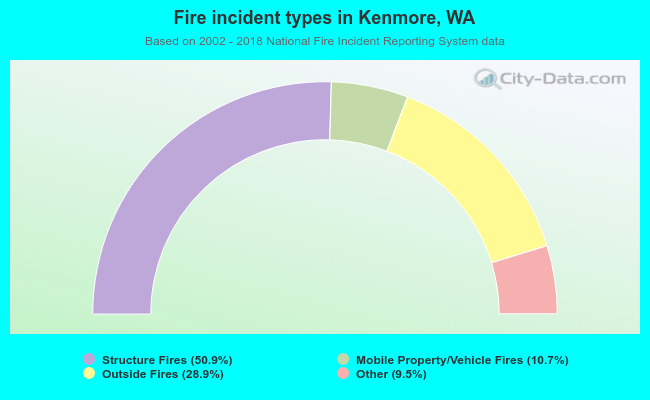 When looking into fire subcategories, the most reports belonged to: Structure Fires (50.9%), and Outside Fires (28.9%).