Mountlake Terrace: Fire Incidents, Washington (WA)
Where are fire incidents reported in Mountlake Terrace, WA
Something went wrong! Please refresh the page.
| Fire incidents reported | |
|---|---|
| Sreet name | Count |
| LAKEVIEW DR | 80 |
| 212 ST | 74 |
| 52 AVE | 68 |
| 220 ST | 62 |
| 236 ST | 60 |
| 56 AVE | 56 |
| 48 AVE | 54 |
| 44 AVE | 50 |
| ST ALBION WAY | 46 |
| 228 ST | 40 |
| 244 ST | 36 |
| 58 AVE | 36 |
| 66 AVE | 34 |
| 53 AVE | 30 |
| 232 ST | 28 |
| 240 ST | 24 |
| 64 AVE | 24 |
| CEDAR WAY | 24 |
| 214 ST | 22 |
| 237 ST | 22 |
| 238 ST | 22 |
| ST. ALBION WAY | 22 |
| 219 ST | 18 |
| 60 AVE | 18 |
| 222 ST | 16 |
| 39 AVE | 16 |
| 51 AVE | 16 |
| 67 PL | 16 |
| 236TH ST | 14 |
| 44TH AVE | 14 |
2002 - 2018 National Fire Incident Reporting System (NFIRS) incidents
- Incident types reported to NFIRS in Mountlake Terrace, WA
- 9,67468.6%Rescue & EMS
- 1,42810.1%Good Intent Call
- 8986.4%Service Call
- 8636.1%Fire
- 6704.8%False Alarm
- 5363.8%Hazardous Condition
- Fire incident types reported to NFIRS in Mountlake Terrace, WA
- 34840.3%Structure Fires
- 31236.2%Outside Fires
- 14616.9%Mobile Property/Vehicle Fires
- 576.6%Other
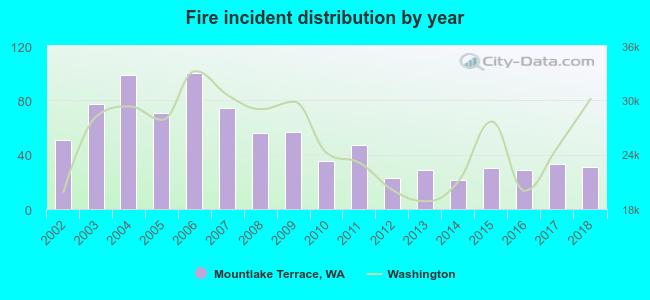 Based on the data from the years 2002 - 2018 the average number of fire incidents per year is 51. The highest number of fire incidents - 100 took place in 2006, and the least - 21 in 2014. The data has a dropping trend.
The average number of yearly fire incidents per 10k residents in Mountlake Terrace, WA compared to nearest cities:
(Note: Based on data for the last 3 years, including only cities with population 5,000 and above)
| Mountlake Terrace: | 14.9 |
| Brier: | 10.4 |
| Lake Forest Park: | 12.6 |
| Lynnwood: | 56.1 |
| Edmonds: | 16.5 |
| Shoreline: | 23.4 |
| Kenmore: | 14.5 |
| Bothell: | 32.5 |
| Mill Creek: | 10.8 |
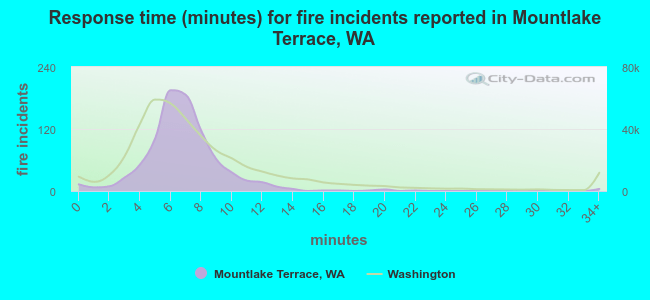 The median response time based on all reported fire incidents is 7 minutes. This is comparable to the Washington median value.
The median response time in Mountlake Terrace, WA compared to nearest cities:
(Note: Based on data for all years, including only cities with at least 500 fire incidents)
| Mountlake Terrace: | 7 minutes |
| Lynnwood: | 7 minutes |
| Edmonds: | 7 minutes |
| Shoreline: | 7 minutes |
| Kenmore: | 6 minutes |
| Bothell: | 6 minutes |
| Woodinville: | 7 minutes |
| Mukilteo: | 6 minutes |
| Kirkland: | 6 minutes |
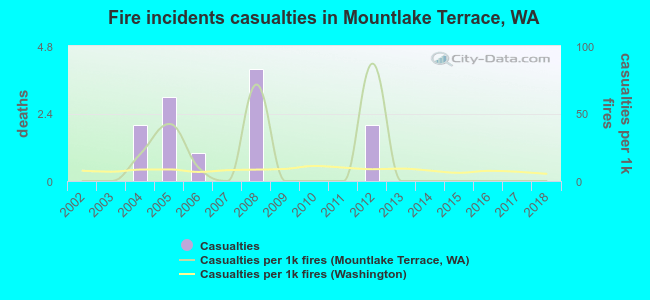 Based on the data from the years 2002 - 2018 the average number of fire-related casualties per year is 1. The highest number of reported injuries - 4 took place in 2008, and the lowest - 0 in 2002. The data has a constant trend.
The average number of casualties per 1,000 fires is 14. This indicator was the highest - 87 in 2012, and the lowest 0 in 2002. The trend for injuries per 1,000 fire incidents is constant. Compared to the Washington value the number of injuries per 1,000 fire incidents is higher.
Based on the data from the years 2002 - 2018 the average number of fire-related casualties per year is 1. The highest number of reported injuries - 4 took place in 2008, and the lowest - 0 in 2002. The data has a constant trend.
The average number of casualties per 1,000 fires is 14. This indicator was the highest - 87 in 2012, and the lowest 0 in 2002. The trend for injuries per 1,000 fire incidents is constant. Compared to the Washington value the number of injuries per 1,000 fire incidents is higher.
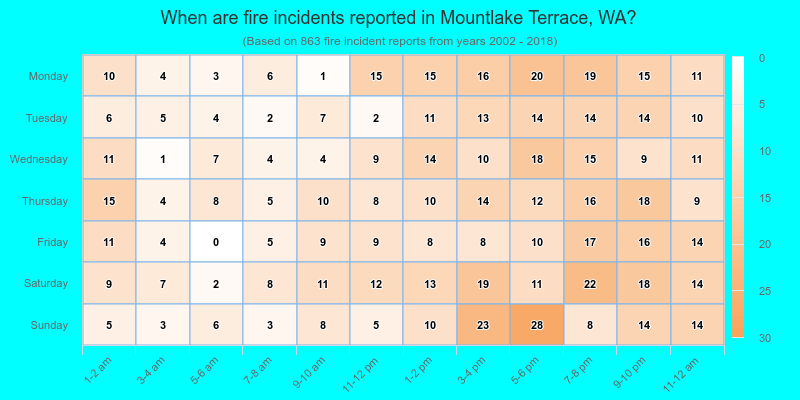
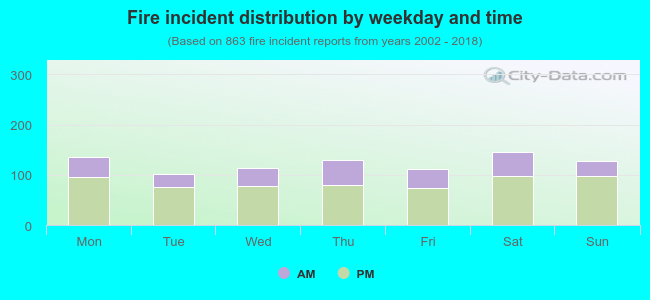 31.1% incidents where reported in the morning and 68.9% in the evening. The most fires (16.9%) took place on Saturday, and the least (11.8%) on Tuesday.
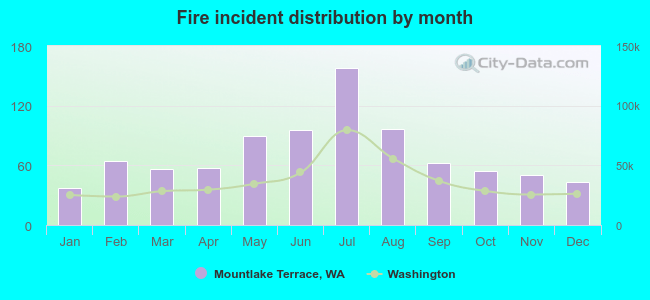 According to the 863 reports from years 2002 - 2018 most fires (18.3%) took place during July, and the least (4.3%) in January.
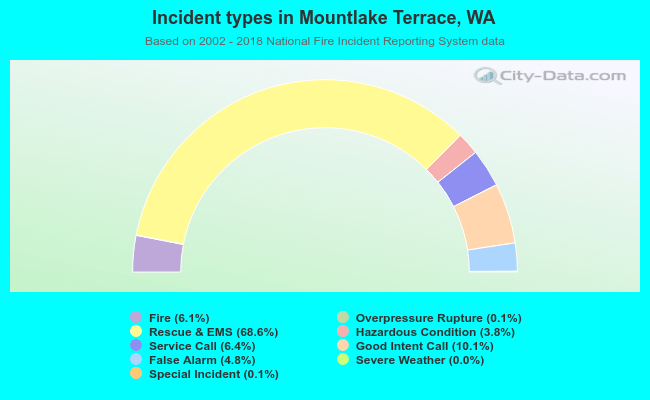 Out of all 14,092 cases reported during the years 2002 - 2018, the most belonged to the categories: Rescue & EMS (68.6%), Good Intent Call (10.1%), and Service Call (6.4%).
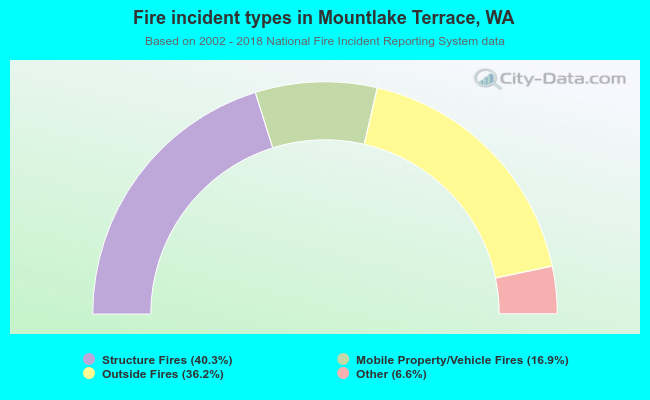 When looking into fire subcategories, the most reports belonged to: Structure Fires (40.3%), and Outside Fires (36.2%).