Canyon Lake: Fire Incidents, Texas (TX)
Where are fire incidents reported in Canyon Lake, TX
Something went wrong! Please refresh the page.
| Fire incidents reported | |
|---|---|
| Sreet name | Count |
| F.M. 306 | 128 |
| FM 306 | 114 |
| F.M. 2673 | 80 |
| FM 2673 | 76 |
| RIVER RD | 62 |
| CRANES MILL RD | 48 |
| GLENN DR | 44 |
| F.M. 32 | 42 |
| RIVER CHASE DR | 36 |
| CANYON PARK RD | 34 |
| ISLAND VIEW DR | 32 |
| JACOBS CREEK PARK RD | 32 |
| POTTERS CREEK RD | 32 |
| PURGATORY RD | 32 |
| SIR ARTHUR WAY | 32 |
| SKYLINE DR | 32 |
| CLARK ST | 28 |
| WEGNER RD | 28 |
| PARKVIEW DR | 26 |
| SIR WINSTON DR | 26 |
| COLLEEN DR | 24 |
| RAMBLING DR | 24 |
| LAKEVIEW DR | 22 |
| MAIL ROUTE RD | 22 |
| FM 32 | 20 |
| GREENWOOD ST | 20 |
| CHIMNEY ROCK | 18 |
| FLINTSTONE DR | 18 |
| SATTLER RD | 18 |
| ACCESS RD | 16 |
| Other | 682 |
2002 - 2018 National Fire Incident Reporting System (NFIRS) incidents
- Incident types reported to NFIRS in Canyon Lake, TX
- 8,10764.4%Rescue & EMS
- 1,84814.7%Fire
- 9447.5%Service Call
- 9197.3%Good Intent Call
- 4233.4%False Alarm
- 3212.6%Hazardous Condition
- Fire incident types reported to NFIRS in Canyon Lake, TX
- 1,11860.5%Outside Fires
- 49226.6%Structure Fires
- 1658.9%Mobile Property/Vehicle Fires
- 734.0%Other
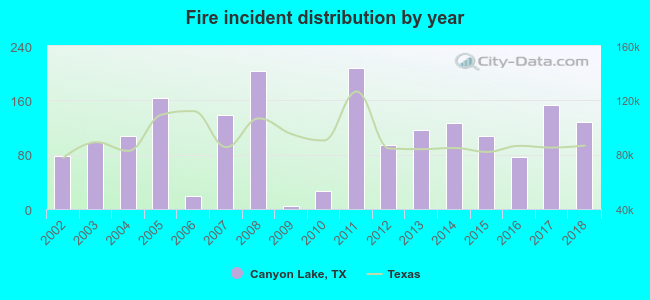 According to the data from the years 2002 - 2018 the average number of fire incidents per year is 109. The highest number of fires - 207 took place in 2011, and the least - 4 in 2009. The data has a rising trend.
The average number of yearly fire incidents per 10k residents in Canyon Lake, TX compared to nearest cities:
(Note: Based on data for the last 3 years, including only cities with population 5,000 and above)
| Canyon Lake: | 56.0 |
| New Braunfels: | 35.5 |
| San Marcos: | 45.9 |
| Selma: | 31.4 |
| Schertz: | 32.5 |
| Cibolo: | 29.5 |
| Universal City: | 28.7 |
| Live Oak: | 4.0 |
| Fair Oaks Ranch: | 18.3 |
 The median response time based on all reported fire incidents is 9 minutes. This is higher than the state median value.
The median response time in Canyon Lake, TX compared to nearest cities:
(Note: Based on data for all years, including only cities with at least 500 fire incidents)
| Canyon Lake: | 9 minutes |
| Bulverde: | 9 minutes |
| Wimberley: | 11 minutes |
| New Braunfels: | 7 minutes |
| Blanco: | 11 minutes |
| San Marcos: | 6 minutes |
| Schertz: | 7 minutes |
| Cibolo: | 8 minutes |
| Universal City: | 5 minutes |
 According to the reports from the years 2002 - 2018 the average number of fire-related casualties per year is 0. The highest number of casualties - 2 took place in 2008, and the lowest - 0 in 2002. The data has a constant trend.
The average number of casualties per 1,000 fire incidents is 3. This indicator was the highest - 37 in 2010, and the lowest 0 in 2002. The trend for injuries per 1,000 fires is constant. Compared to the state value the number of casualties per 1,000 fires is much lower.
According to the reports from the years 2002 - 2018 the average number of fire-related casualties per year is 0. The highest number of casualties - 2 took place in 2008, and the lowest - 0 in 2002. The data has a constant trend.
The average number of casualties per 1,000 fire incidents is 3. This indicator was the highest - 37 in 2010, and the lowest 0 in 2002. The trend for injuries per 1,000 fires is constant. Compared to the state value the number of casualties per 1,000 fires is much lower.Casualties per 1,000 incidents in Canyon Lake, TX compared to nearest cities:
(Note: Based on data for all years, including only cities with at least 500 fire incidents)
| Canyon Lake: | 2.2 |
| Bulverde: | 0.0 |
| Wimberley: | 1.2 |
| New Braunfels: | 11.2 |
| Blanco: | 1.2 |
| San Marcos: | 5.7 |
| Schertz: | 7.5 |
| Cibolo: | 5.2 |
| Universal City: | 23.8 |
 25.7% incidents where reported in the morning and 74.3% in the evening. The most fires (16.0%) took place on Saturday, and the least (12.6%) on Tuesday.
 Based on the 1,848 fire incidents from years 2002 - 2018 most fires (12.3%) took place during July, and the least (5.8%) in November.
 Out of all 12,583 cases reported during the years 2002 - 2018, the most belonged to the categories: Rescue & EMS (64.4%), Fire (14.7%), and Service Call (7.5%).
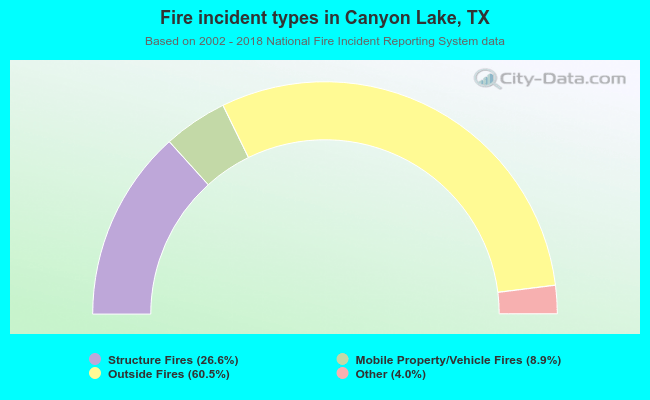 When looking into fire subcategories, the most reports belonged to: Outside Fires (60.5%), and Structure Fires (26.6%).