Kirksville: Fire Incidents, Missouri (MO)
Where are fire incidents reported in Kirksville, MO
Something went wrong! Please refresh the page.
| Fire incidents reported | |
|---|---|
| Sreet name | Count |
| BALTIMORE ST | 162 |
| FRANKLIN ST | 88 |
| OSTEOPATHY | 68 |
| ILLINOIS ST | 46 |
| JEFFERSON ST | 42 |
| MULANIX ST | 36 |
| FLORENCE ST | 30 |
| INDUSTRIAL RD | 30 |
| NORMAL AVE | 30 |
| FIRST ST | 28 |
| PATTERSON ST | 28 |
| WASHINGTON ST | 28 |
| ELSON ST | 26 |
| JAMISON ST | 24 |
| MARION ST | 24 |
| CENTENNIAL AVE | 22 |
| HARRISON ST | 22 |
| HIGH ST | 22 |
| MICHIGAN ST | 22 |
| COTTONWOOD ST | 20 |
| BOUNDARY ST | 18 |
| GARDNER ST | 18 |
| LAHARPE ST | 18 |
| PIERCE ST | 18 |
| LINCOLN ST | 16 |
| BURTON ST | 14 |
| COTTAGE GROVE AVE | 14 |
| HALLIBURTON ST | 14 |
| PORTER ST | 14 |
| WALNUT ST | 14 |
| Other | 57 |
2002 - 2018 National Fire Incident Reporting System (NFIRS) incidents
- Incident types reported to NFIRS in Kirksville, MO
- 5,61762.7%Rescue & EMS
- 1,01311.3%Fire
- 7638.5%Hazardous Condition
- 6497.2%False Alarm
- 4615.1%Good Intent Call
- 4044.5%Service Call
- 340.4%Special Incident
- 150.2%Overpressure Rupture
- Fire incident types reported to NFIRS in Kirksville, MO
- 41340.8%Structure Fires
- 41340.8%Outside Fires
- 16816.6%Mobile Property/Vehicle Fires
- 191.9%Other
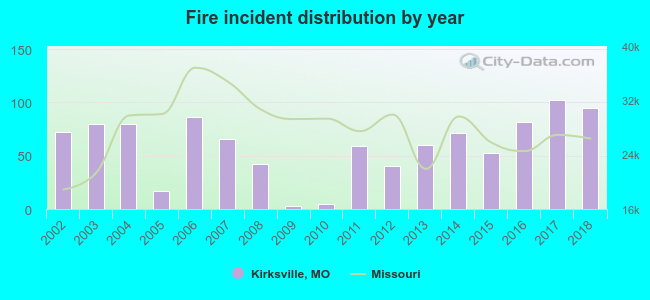 According to the data from the years 2002 - 2018 the average number of fire incidents per year is 60. The highest number of reported fire incidents - 102 took place in 2017, and the least - 3 in 2009. The data has a growing trend.
The average number of yearly fire incidents per 10k residents in Kirksville, MO compared to nearest cities:
(Note: Based on data for the last 3 years, including only cities with population 5,000 and above)
| Kirksville: | 52.7 |
| Macon: | 71.1 |
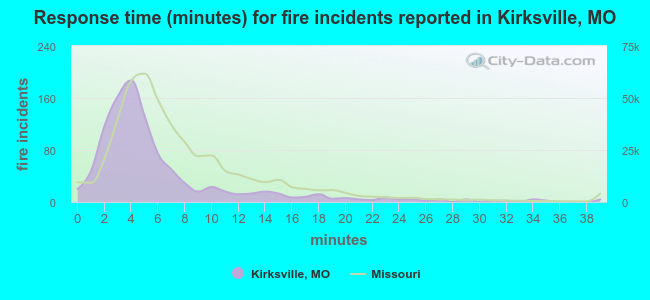 The median response time based on all reported fire incidents is 4 minutes. This is lower compared to the Missouri median value.
The median response time in Kirksville, MO compared to nearest cities:
(Note: Based on data for all years, including only cities with at least 500 fire incidents)
| Kirksville: | 4 minutes |
| Macon: | 4 minutes |
| Centerville: | 4 minutes |
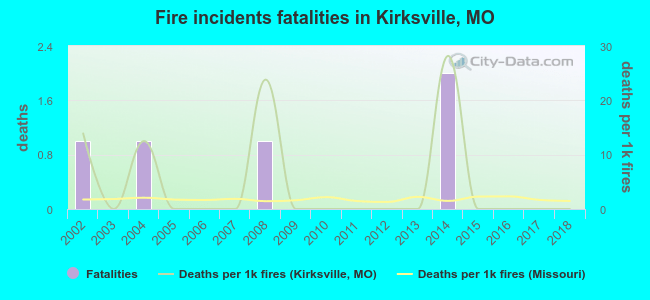 According to the data from the years 2002 - 2018 the average number of fire-related fatalities per year is 0. The highest number of reported deaths - 2 took place in 2014, and the lowest - 0 in 2003. The data has a dropping trend.
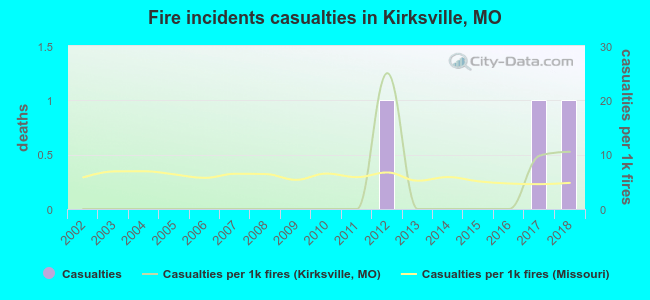 Based on the reports from the years 2002 - 2018 the average number of fire-related casualties per year is 0. The highest number of reported casualties - 1 took place in 2012, and the lowest - 0 in 2002. The data has a growing trend.
The average number of casualties per 1,000 fire incidents is 3. This indicator was the highest - 25 in 2012, and the lowest 0 in 2002. The trend for casualties per 1,000 fire incidents is rising. Compared to the Missouri value the number of casualties per 1,000 incidents is lower.
Based on the reports from the years 2002 - 2018 the average number of fire-related casualties per year is 0. The highest number of reported casualties - 1 took place in 2012, and the lowest - 0 in 2002. The data has a growing trend.
The average number of casualties per 1,000 fire incidents is 3. This indicator was the highest - 25 in 2012, and the lowest 0 in 2002. The trend for casualties per 1,000 fire incidents is rising. Compared to the Missouri value the number of casualties per 1,000 incidents is lower.Casualties per 1,000 incidents in Kirksville, MO compared to nearest cities:
(Note: Based on data for all years, including only cities with at least 500 fire incidents)
| Kirksville: | 3.0 |
| Macon: | 3.6 |
| Centerville: | 22.1 |
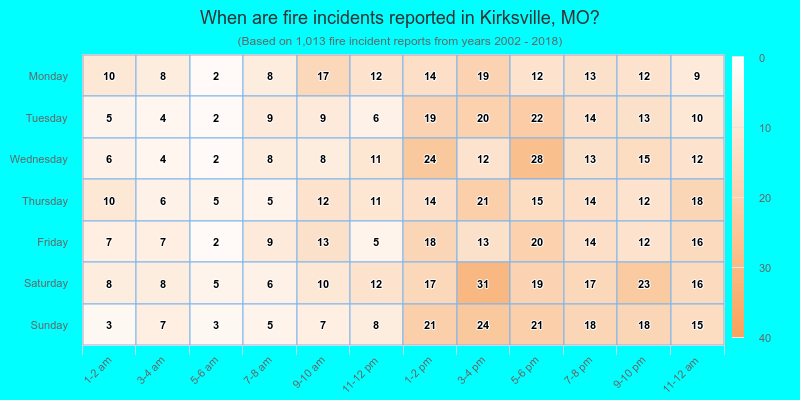
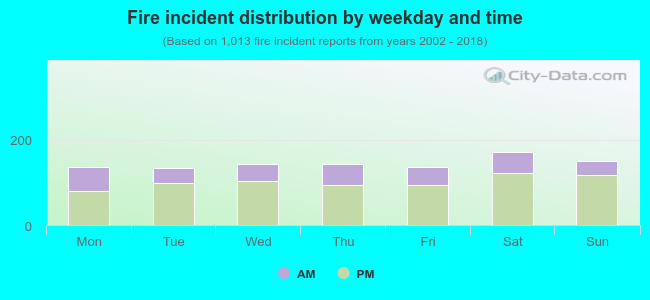 30.1% incidents where reported in the morning and 69.9% in the evening. The most fires (17.0%) took place on Saturday, and the least (13.1%) on Tuesday.
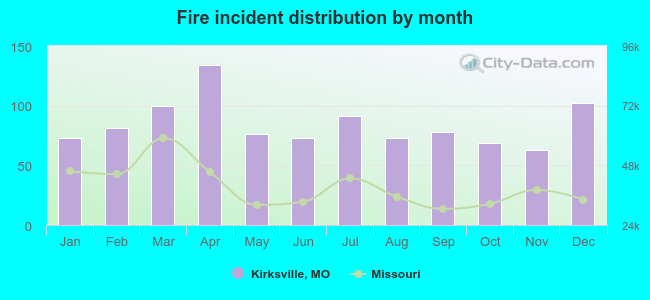 Based on the 1,013 fire incidents from years 2002 - 2018 most fires (13.2%) took place during April, and the least (6.2%) in November.
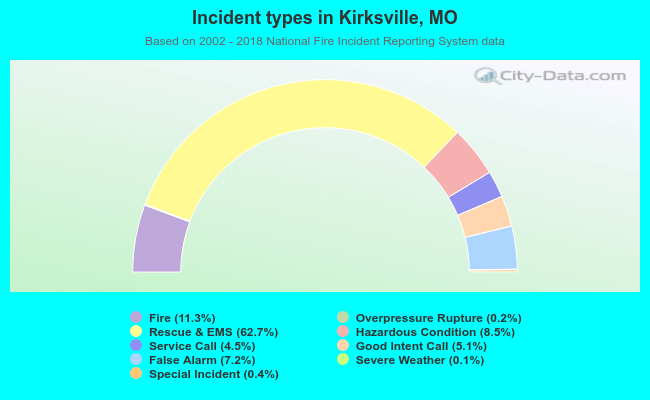 Out of all 8,961 cases reported during the years 2002 - 2018, the most belonged to the categories: Rescue & EMS (62.7%), Fire (11.3%), and Hazardous Condition (8.5%).
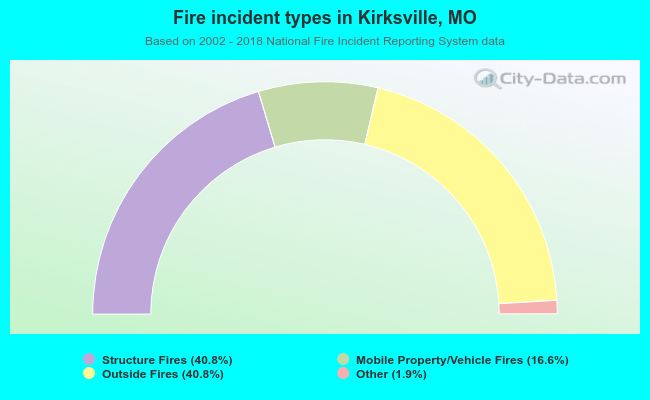 When looking into fire subcategories, the most incidents belonged to: Structure Fires (40.8%), and Outside Fires (40.8%).