Macon: Fire Incidents, Missouri (MO)
Where are fire incidents reported in Macon, MO
Something went wrong! Please refresh the page.
|
| |||||||||||||||||||||||||||||||||||||||||||||||||||||||||||||||||||||||||||||||||||||||||||||||||||||||||||||
2002 - 2018 National Fire Incident Reporting System (NFIRS) incidents
- Incident types reported to NFIRS in Macon, MO
- 1,63849.3%Rescue & EMS
- 55616.7%Fire
- 38211.5%Hazardous Condition
- 35710.7%Service Call
- 2276.8%Good Intent Call
- 1564.7%False Alarm
- Fire incident types reported to NFIRS in Macon, MO
- 23542.3%Structure Fires
- 21037.8%Outside Fires
- 9016.2%Mobile Property/Vehicle Fires
- 213.8%Other
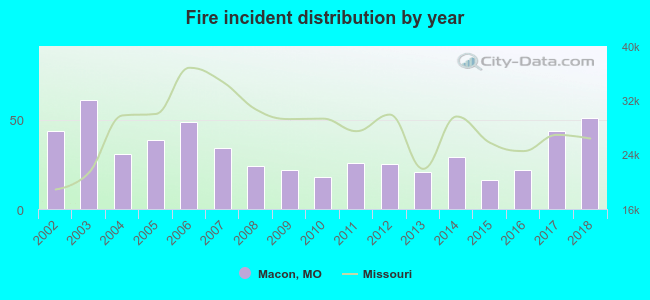 Based on the data from the years 2002 - 2018 the average number of fire incidents per year is 33. The highest number of fires - 61 took place in 2003, and the least - 16 in 2015. The data has a growing trend.
The average number of yearly fire incidents per 10k residents in Macon, MO compared to nearest cities:
(Note: Based on data for the last 3 years, including only cities with population 5,000 and above)
| Macon: | 71.1 |
| Moberly: | 54.7 |
| Kirksville: | 52.7 |
 The median response time based on all reported fire incidents is 4 minutes. This is lower than the state median value.
The median response time in Macon, MO compared to nearest cities:
(Note: Based on data for all years, including only cities with at least 500 fire incidents)
| Macon: | 4 minutes |
| Moberly: | 5 minutes |
| Kirksville: | 4 minutes |
 According to the reports from the years 2002 - 2018 the average number of fire-related fatalities per year is 1. The highest number of deaths - 4 took place in 2004, and the lowest - 0 in 2002. The data has a constant trend.
 29.7% incidents where reported in the morning and 70.3% in the evening. The most fires (17.8%) took place on Saturday, and the least (11.3%) on Wednesday.
 Based on the 556 fires from years 2002 - 2018 most fires (11.7%) took place during March, and the least (4.9%) in September.
 Out of all 3,321 cases reported during the years 2002 - 2018, the most belonged to the categories: Rescue & EMS (49.3%), Fire (16.7%), and Hazardous Condition (11.5%).
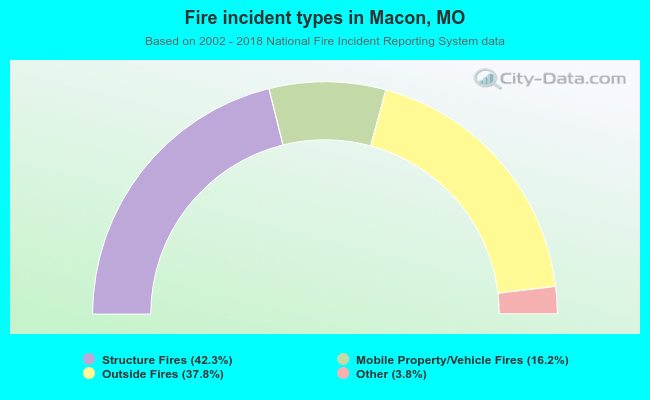 When looking into fire subcategories, the most reports belonged to: Structure Fires (42.3%), and Outside Fires (37.8%).