La Grange: Fire Incidents, Illinois (IL)
Where are fire incidents reported in La Grange, IL
Something went wrong! Please refresh the page.
|
| |||||||||||||||||||||||||||||||||||||||||||||||||||||||||||||||||||||||||||||||||||||||||||||||||||||||||||||
2004 - 2018 National Fire Incident Reporting System (NFIRS) incidents
- Incident types reported to NFIRS in La Grange, IL
- 2,95848.5%Rescue & EMS
- 96415.8%Hazardous Condition
- 76712.6%False Alarm
- 68911.3%Good Intent Call
- 4607.5%Fire
- 2393.9%Service Call
- 110.2%Special Incident
- 70.1%Overpressure Rupture
- Fire incident types reported to NFIRS in La Grange, IL
- 25755.9%Structure Fires
- 13429.1%Outside Fires
- 449.6%Mobile Property/Vehicle Fires
- 255.4%Other
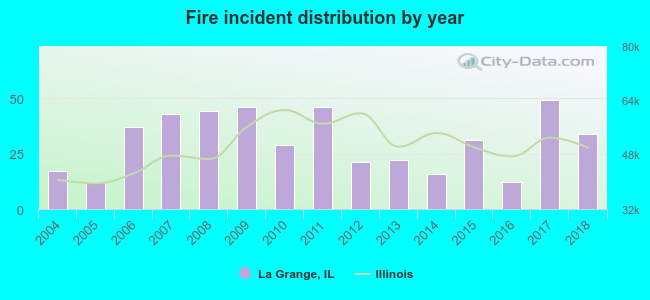 Based on the data from the years 2004 - 2018 the average number of fires per year is 31. The highest number of fires - 49 took place in 2017, and the least - 12 in 2005. The data has a growing trend.
The average number of yearly fire incidents per 10k residents in La Grange, IL compared to nearest cities:
(Note: Based on data for the last 3 years, including only cities with population 5,000 and above)
| La Grange: | 20.1 |
| Western Springs: | 18.3 |
| La Grange Park: | 15.4 |
| Brookfield: | 36.6 |
| Countryside: | 48.1 |
| Lyons: | 67.8 |
| Hinsdale: | 25.2 |
| Westchester: | 37.1 |
| Summit: | 57.7 |
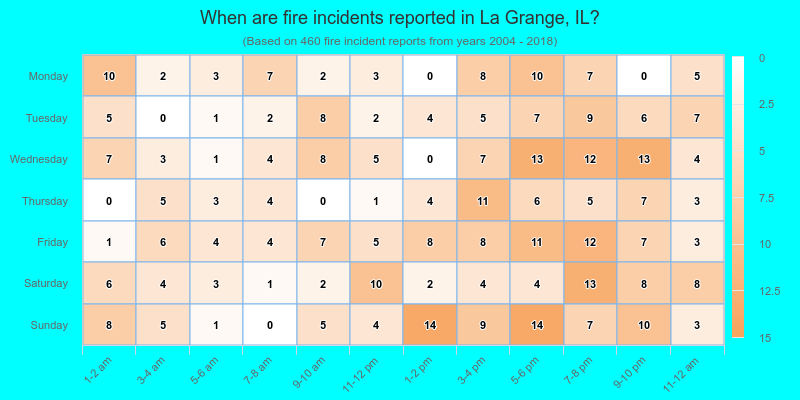
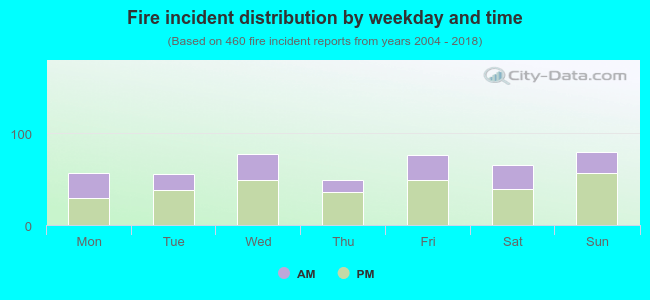 35.2% incidents where reported in the morning and 64.8% in the evening. The most fires (17.4%) took place on Sunday, and the least (10.7%) on Thursday.
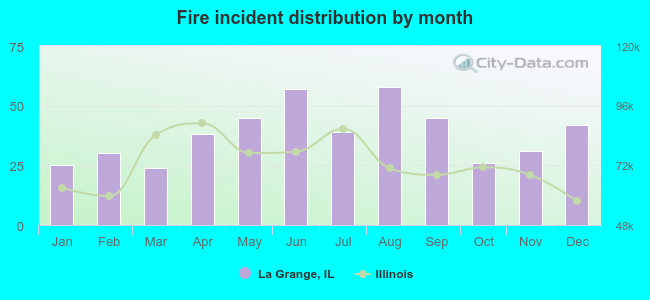 According to the 460 fire incidents from years 2004 - 2018 most fires (12.6%) took place during August, and the least (5.2%) in March.
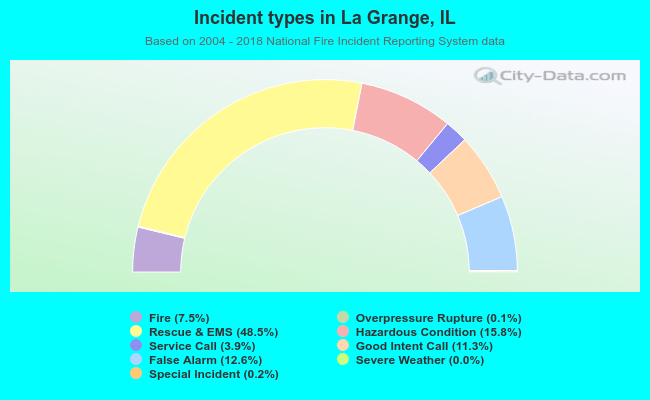 Out of all 6,097 cases reported during the years 2004 - 2018, the most belonged to the categories: Rescue & EMS (48.5%), Hazardous Condition (15.8%), and False Alarm (12.6%).
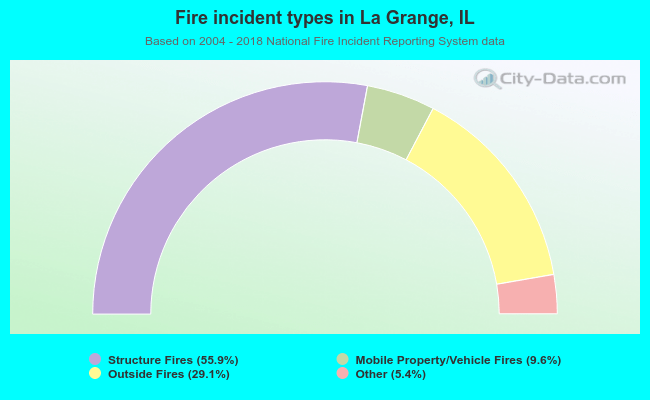 When looking into fire subcategories, the most reports belonged to: Structure Fires (55.9%), and Outside Fires (29.1%).