Countryside: Fire Incidents, Illinois (IL)
Where are fire incidents reported in Countryside, IL
Something went wrong! Please refresh the page.
|
| |||||||||||||||||||||||||||||||||||||||||||||||||||||||||||||||||||||||||||||||||||||||||||||||||||||||||||||
2002 - 2018 National Fire Incident Reporting System (NFIRS) incidents
- Incident types reported to NFIRS in Countryside, IL
- 3,10156.6%Rescue & EMS
- 72413.2%False Alarm
- 59410.9%Service Call
- 3887.1%Fire
- 3746.8%Hazardous Condition
- 2845.2%Good Intent Call
- 60.1%Special Incident
- Fire incident types reported to NFIRS in Countryside, IL
- 22457.7%Structure Fires
- 10226.3%Outside Fires
- 5113.1%Mobile Property/Vehicle Fires
- 112.8%Other
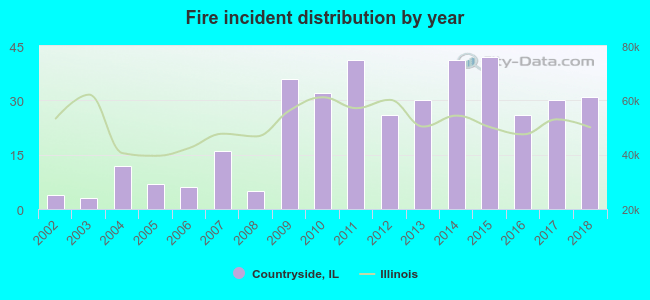 Based on the data from the years 2002 - 2018 the average number of fires per year is 23. The highest number of fire incidents - 42 took place in 2015, and the least - 3 in 2003. The data has a growing trend.
The average number of yearly fire incidents per 10k residents in Countryside, IL compared to nearest cities:
(Note: Based on data for the last 3 years, including only cities with population 5,000 and above)
| Countryside: | 48.1 |
| La Grange: | 20.1 |
| Western Springs: | 18.3 |
| Willow Springs: | 46.1 |
| Burr Ridge: | 28.8 |
| Justice: | 60.7 |
| Summit: | 57.7 |
| Hinsdale: | 25.2 |
| Brookfield: | 36.6 |
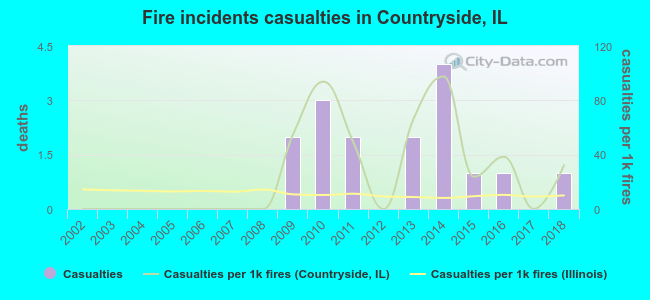 According to the data from the years 2002 - 2018 the average number of fire-related casualties per year is 1. The highest number of reported casualties - 4 took place in 2014, and the lowest - 0 in 2002. The data has a growing trend.
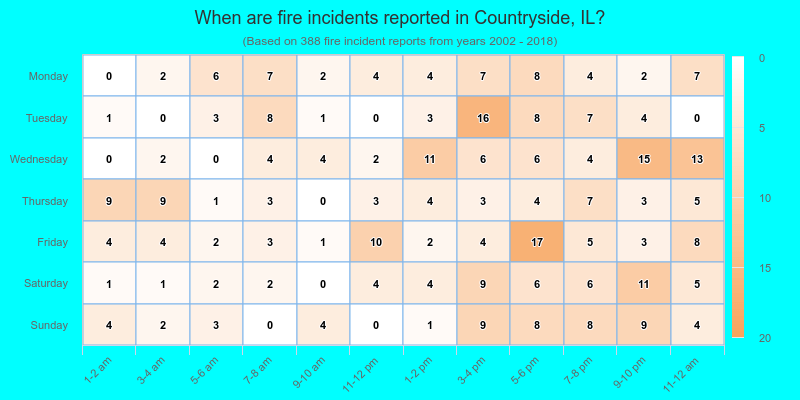
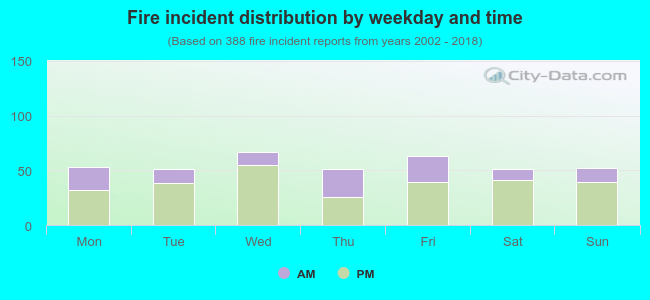 30.4% incidents where reported in the morning and 69.6% in the evening. The most fires (17.3%) took place on Wednesday, and the least (13.1%) on Tuesday.
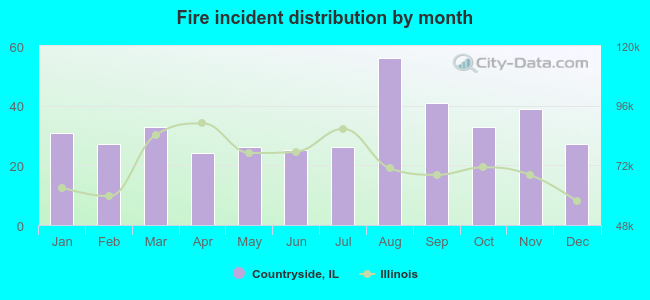 Based on the 388 fire incident reports from years 2002 - 2018 most fires (14.4%) took place during August, and the least (6.2%) in April.
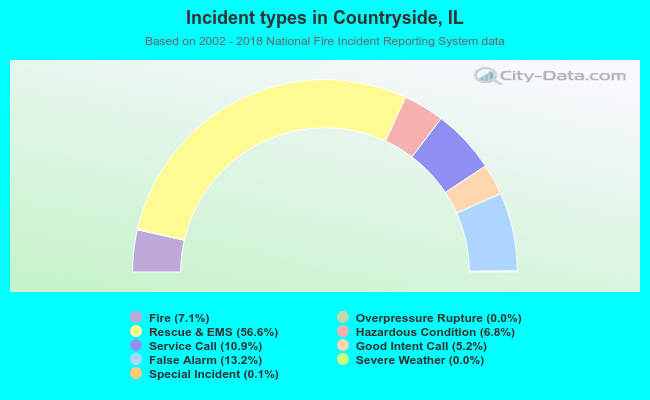 Out of all 5,474 cases reported during the years 2002 - 2018, the most belonged to the categories: Rescue & EMS (56.6%), False Alarm (13.2%), and Service Call (10.9%).
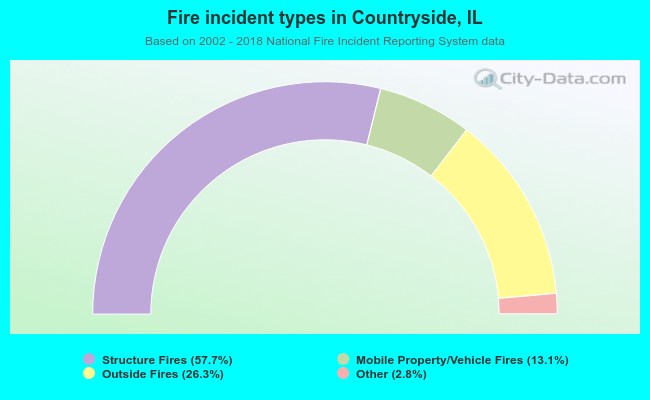 When looking into fire subcategories, the most incidents belonged to: Structure Fires (57.7%), and Outside Fires (26.3%).