League City: Fire Incidents, Texas (TX)
Where are fire incidents reported in League City, TX
Something went wrong! Please refresh the page.
| Fire incidents reported | |
|---|---|
| Sreet name | Count |
| MAIN ST | 176 |
| LEAGUE CITY | 150 |
| GULF FWY | 144 |
| MARINA BAY DR | 80 |
| FM 646 | 72 |
| IH 45 FWY | 70 |
| SH 3 | 66 |
| WALKER ST | 62 |
| FM 518 | 60 |
| DAVIS RD | 46 |
| CALDER DR | 40 |
| SOUTH SHORE BLVD | 36 |
| TEXAS AVE | 34 |
| ENTERPRISE AVE | 32 |
| FM 517 | 28 |
| ST CHRISTOPHER AVE | 28 |
| CONSTELLATION BLVD | 26 |
| EGRET BAY BLVD | 26 |
| HOBBS RD | 24 |
| WACO AVE | 22 |
| WEBSTER ST | 22 |
| WESLEY DR | 22 |
| ILLINOIS AVE | 20 |
| MARY LN | 20 |
| CALDER RD | 18 |
| CORYELL ST | 18 |
| LEAGUE CITY PKWY | 18 |
| OHIO AVE | 18 |
| SAUNDERS ST | 18 |
| FM 528 | 16 |
| Other | 275 |
2002 - 2018 National Fire Incident Reporting System (NFIRS) incidents
- Incident types reported to NFIRS in League City, TX
- 2,54528.4%Hazardous Condition
- 1,68718.8%Fire
- 1,66318.5%False Alarm
- 1,50916.8%Good Intent Call
- 1,15712.9%Rescue & EMS
- 3634.0%Service Call
- 220.2%Severe Weather
- 160.2%Overpressure Rupture
- 90.1%Special Incident
- Fire incident types reported to NFIRS in League City, TX
- 71642.4%Outside Fires
- 65438.8%Structure Fires
- 28917.1%Mobile Property/Vehicle Fires
- 281.7%Other
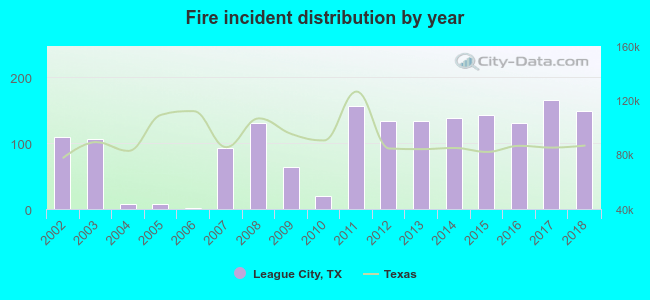 According to the data from the years 2002 - 2018 the average number of fire incidents per year is 99. The highest number of reported fire incidents - 165 took place in 2017, and the least - 1 in 2006. The data has a growing trend.
The average number of yearly fire incidents per 10k residents in League City, TX compared to nearest cities:
(Note: Based on data for the last 3 years, including only cities with population 5,000 and above)
| League City: | 15.7 |
| Webster: | 63.6 |
| Dickinson: | 40.8 |
| Bacliff: | 40.6 |
| Seabrook: | 13.6 |
| Friendswood: | 21.8 |
| Santa Fe: | 71.3 |
| La Marque: | 41.9 |
| Texas City: | 44.2 |
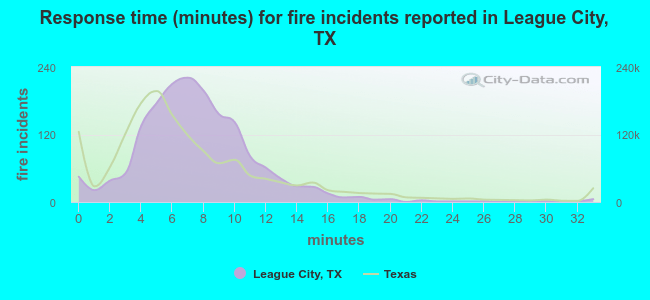 The median response time based on all reported fire incidents is 7 minutes. This is close to the Texas median value.
The median response time in League City, TX compared to nearest cities:
(Note: Based on data for all years, including only cities with at least 500 fire incidents)
| League City: | 7 minutes |
| Webster: | 5 minutes |
| Dickinson: | 6 minutes |
| Seabrook: | 8 minutes |
| Friendswood: | 5 minutes |
| Santa Fe: | 7 minutes |
| La Marque: | 5 minutes |
| Texas City: | 6 minutes |
| La Porte: | 3 minutes |
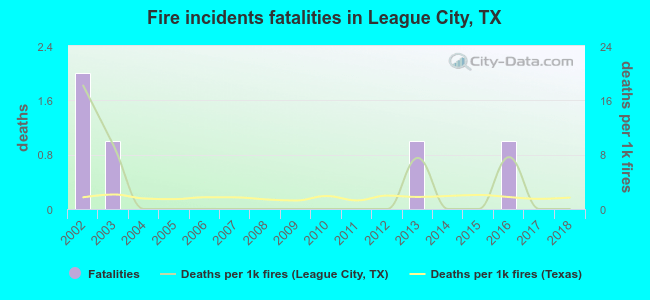 Based on the reports from the years 2002 - 2018 the average number of fire-related yearly deaths is 0. The highest number of deaths - 2 took place in 2002, and the lowest - 0 in 2004. The data has a declining trend.
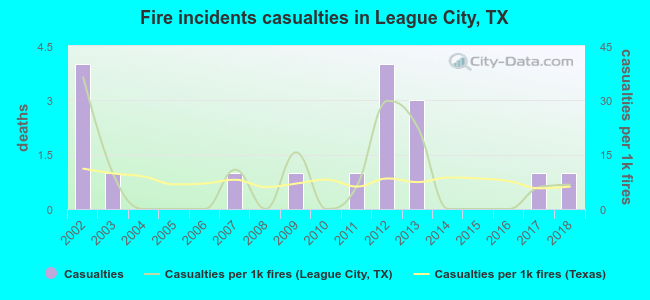 Based on the data from the years 2002 - 2018 the average number of fire-related casualties per year is 1. The highest number of injuries - 4 took place in 2002, and the lowest - 0 in 2004. The data has a declining trend.
The average number of injuries per 1,000 fires is 8. This indicator was the highest - 36 in 2002, and the lowest 0 in 2004. The trend for casualties per 1,000 fire incidents is decreasing. Compared to the Texas value the number of injuries per 1,000 fire incidents is higher.
Based on the data from the years 2002 - 2018 the average number of fire-related casualties per year is 1. The highest number of injuries - 4 took place in 2002, and the lowest - 0 in 2004. The data has a declining trend.
The average number of injuries per 1,000 fires is 8. This indicator was the highest - 36 in 2002, and the lowest 0 in 2004. The trend for casualties per 1,000 fire incidents is decreasing. Compared to the Texas value the number of injuries per 1,000 fire incidents is higher.Casualties per 1,000 incidents in League City, TX compared to nearest cities:
(Note: Based on data for all years, including only cities with at least 500 fire incidents)
| League City: | 10.1 |
| Webster: | 10.9 |
| Dickinson: | 11.5 |
| Seabrook: | 3.6 |
| Friendswood: | 11.9 |
| Santa Fe: | 2.9 |
| La Marque: | 10.2 |
| Texas City: | 4.2 |
| La Porte: | 0.0 |
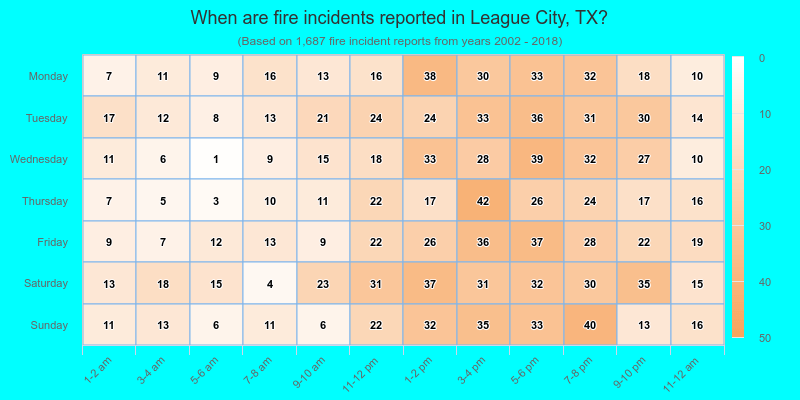
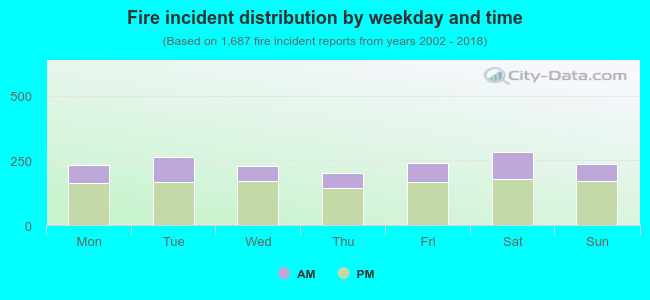 31.4% incidents where reported in the morning and 68.6% in the evening. The most fires (16.8%) took place on Saturday, and the least (11.9%) on Thursday.
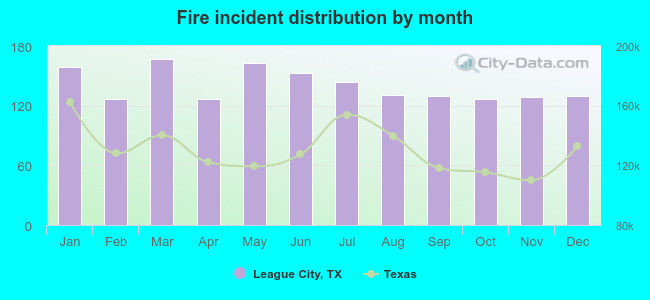 According to the 1,687 incident reports from years 2002 - 2018 most fires (9.9%) took place during March, and the least (7.5%) in February.
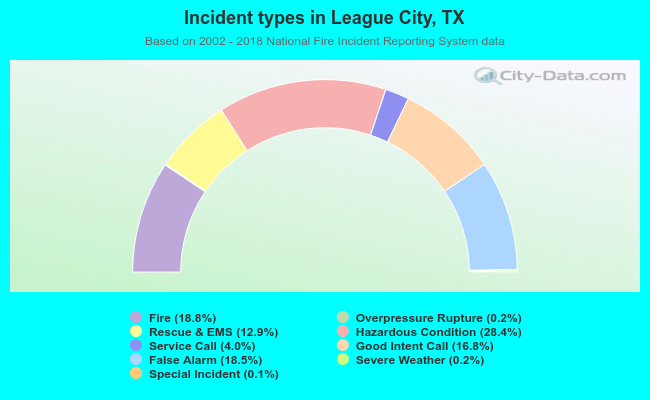 Out of all 8,971 cases reported during the years 2002 - 2018, the most belonged to the categories: Hazardous Condition (28.4%), Fire (18.8%), and False Alarm (18.5%).
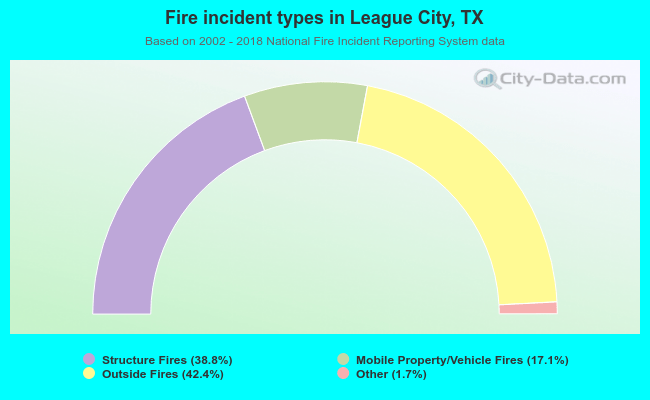 When looking into fire subcategories, the most incidents belonged to: Outside Fires (42.4%), and Structure Fires (38.8%).