LaGrange: Fire Incidents, Georgia (GA)
Where are fire incidents reported in LaGrange, GA
Something went wrong! Please refresh the page.
| Fire incidents reported | |
|---|---|
| Sreet name | Count |
| GREENWOOD ST | 216 |
| HAMILTON RD | 194 |
| NEW FRANKLIN RD | 192 |
| HOGANSVILLE RD | 170 |
| WHITESVILLE RD | 146 |
| WEST POINT RD | 144 |
| INTERSTATE 85 | 128 |
| I-85 EXPY | 126 |
| MOOTY BRIDGE RD | 122 |
| LAFAYETTE PKY | 120 |
| COMMERCE AVE | 112 |
| BARTLEY RD | 100 |
| GREENVILLE RD | 96 |
| DAVIS RD | 88 |
| TURNER ST | 78 |
| ROANOKE RD | 76 |
| YOUNGS MILL RD | 76 |
| COOLEY RD | 72 |
| WHITESVILLE ST | 72 |
| UPPER BIG SPRINGS RD | 68 |
| CARY ST | 66 |
| HAMILTON ST | 66 |
| I-85 | 64 |
| GREENVILLE ST | 62 |
| I-185 EXPY | 60 |
| OLD AIRPORT RD | 60 |
| PARK AVE | 60 |
| LUKKEN INDUSTRIAL DR | 58 |
| ORCHARD HILL RD | 56 |
| VERNON RD | 52 |
| Other | 2,220 |
2002 - 2018 National Fire Incident Reporting System (NFIRS) incidents
- Incident types reported to NFIRS in LaGrange, GA
- 16,35552.3%Rescue & EMS
- 5,22016.7%Fire
- 3,59011.5%Good Intent Call
- 2,5658.2%Hazardous Condition
- 2,1376.8%False Alarm
- 1,1793.8%Service Call
- 810.3%Overpressure Rupture
- 600.2%Severe Weather
- 580.2%Special Incident
- Fire incident types reported to NFIRS in LaGrange, GA
- 2,19342.0%Outside Fires
- 1,79034.3%Structure Fires
- 92917.8%Mobile Property/Vehicle Fires
- 3085.9%Other
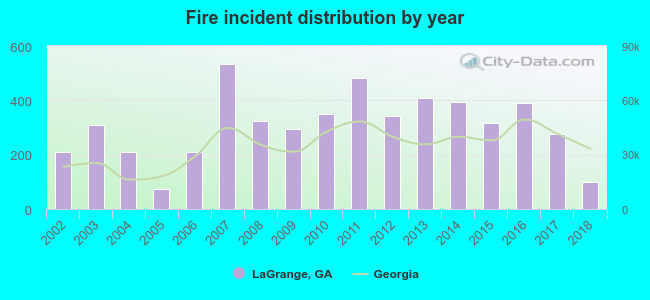 According to the data from the years 2002 - 2018 the average number of fires per year is 307. The highest number of reported fires - 532 took place in 2007, and the least - 74 in 2005. The data has a declining trend.
The average number of yearly fire incidents per 10k residents in LaGrange, GA compared to nearest cities:
(Note: Based on data for the last 3 years, including only cities with population 5,000 and above)
| LaGrange: | 83.3 |
| Newnan: | 88.9 |
| Peachtree City: | 15.6 |
| Carrollton: | 157.7 |
| Columbus: | 30.5 |
| Tyrone: | 30.8 |
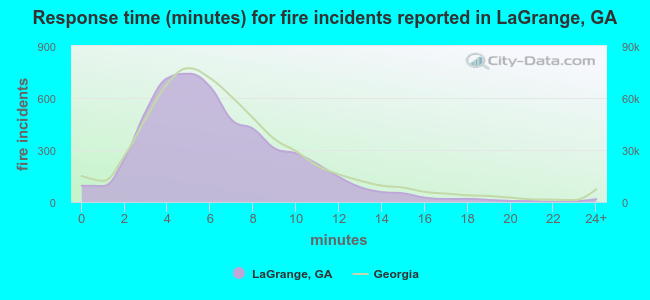 The median response time based on all reported fire incidents is 6 minutes. This is about the same as the Georgia median value.
The median response time in LaGrange, GA compared to nearest cities:
(Note: Based on data for all years, including only cities with at least 500 fire incidents)
| LaGrange: | 6 minutes |
| Hogansville: | 7 minutes |
| West Point: | 6 minutes |
| Pine Mountain: | 8 minutes |
| Franklin: | 6 minutes |
| Valley: | 6 minutes |
| Roanoke: | 5 minutes |
| Newnan: | 6 minutes |
| Sharpsburg: | 6 minutes |
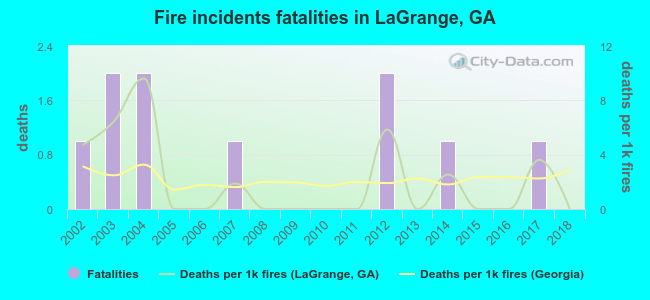 According to the reports from the years 2002 - 2018 the average number of fire-related yearly deaths is 1. The highest number of reported deaths - 2 took place in 2003, and the lowest - 0 in 2005. The data has a decreasing trend.
The average number of deaths per 1,000 fire incidents is 2. This indicator was the highest - 10 in 2004, and the lowest 0 in 2005. The trend for fatalities per 1,000 fires is dropping. Compared to the Georgia value the number of deaths per 1,000 fire incidents is similar.
According to the reports from the years 2002 - 2018 the average number of fire-related yearly deaths is 1. The highest number of reported deaths - 2 took place in 2003, and the lowest - 0 in 2005. The data has a decreasing trend.
The average number of deaths per 1,000 fire incidents is 2. This indicator was the highest - 10 in 2004, and the lowest 0 in 2005. The trend for fatalities per 1,000 fires is dropping. Compared to the Georgia value the number of deaths per 1,000 fire incidents is similar.Deaths per 1,000 incidents in LaGrange, GA compared to nearest cities:
(Note: Based on data for all years, including only cities with at least 2,500 fire incidents)
| LaGrange: | 1.9 |
| Newnan: | 0.5 |
| Carrollton: | 2.3 |
| Columbus: | 2.0 |
| Phenix City: | 2.5 |
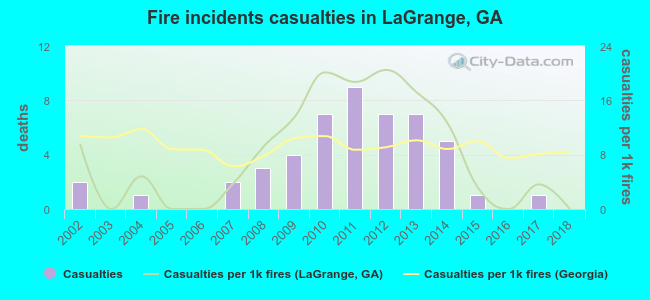 According to the reports from the years 2002 - 2018 the average number of fire-related yearly casualties is 3. The highest number of injuries - 9 took place in 2011, and the lowest - 0 in 2003. The data has a declining trend.
The average number of injuries per 1,000 fire incidents is 8. This indicator was the highest - 20 in 2012, and the lowest 0 in 2003. The trend for injuries per 1,000 incidents is decreasing. Compared to the Georgia value the number of casualties per 1,000 fire incidents is similar.
According to the reports from the years 2002 - 2018 the average number of fire-related yearly casualties is 3. The highest number of injuries - 9 took place in 2011, and the lowest - 0 in 2003. The data has a declining trend.
The average number of injuries per 1,000 fire incidents is 8. This indicator was the highest - 20 in 2012, and the lowest 0 in 2003. The trend for injuries per 1,000 incidents is decreasing. Compared to the Georgia value the number of casualties per 1,000 fire incidents is similar.Casualties per 1,000 incidents in LaGrange, GA compared to nearest cities:
(Note: Based on data for all years, including only cities with at least 500 fire incidents)
| LaGrange: | 9.4 |
| Hogansville: | 3.1 |
| West Point: | 7.3 |
| Pine Mountain: | 1.7 |
| Franklin: | 2.0 |
| Valley: | 8.9 |
| Roanoke: | 12.1 |
| Newnan: | 3.2 |
| Sharpsburg: | 6.1 |
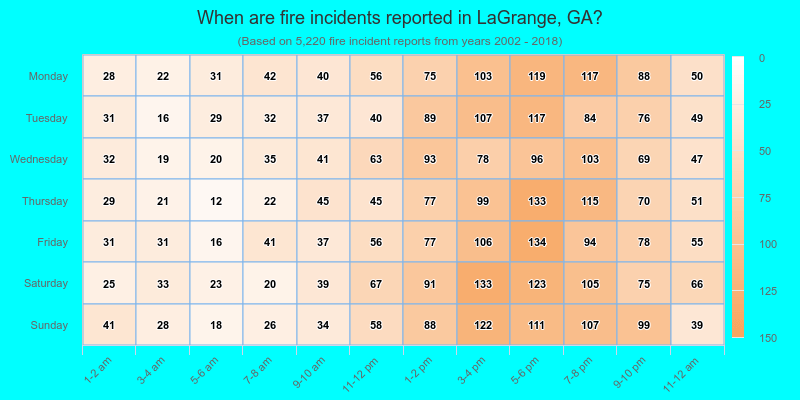
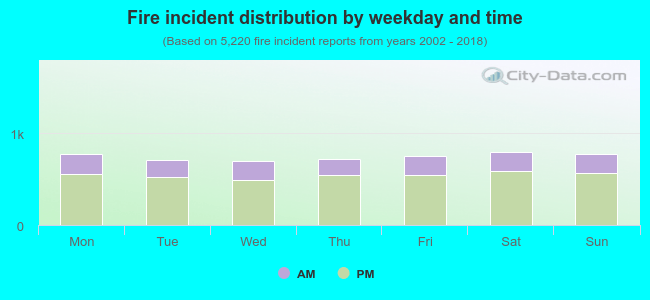 27.0% incidents where reported in the morning and 73.0% in the evening. The most fires (15.3%) took place on Saturday, and the least (13.3%) on Wednesday.
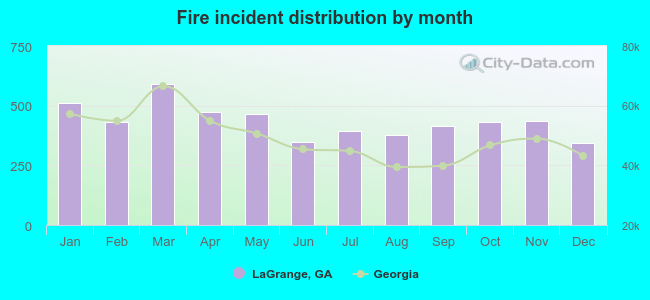 According to the 5,220 incident reports from years 2002 - 2018 most fires (11.3%) took place during March, and the least (6.6%) in December.
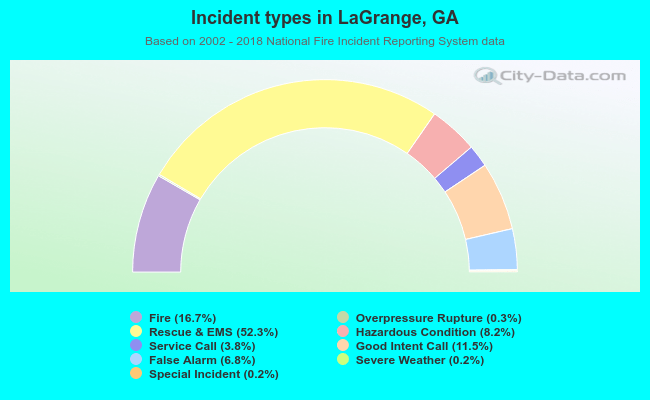 Out of all 31,245 cases reported during the years 2002 - 2018, the most belonged to the categories: Rescue & EMS (52.3%), Fire (16.7%), and Good Intent Call (11.5%).
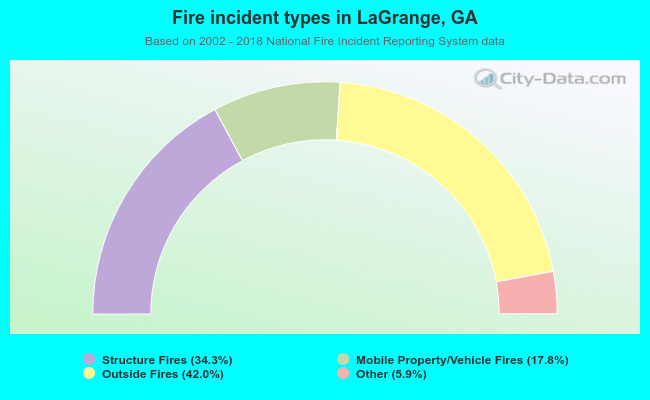 When looking into fire subcategories, the most incidents belonged to: Outside Fires (42.0%), and Structure Fires (34.3%).