Columbus: Fire Incidents, Georgia (GA)
Where are fire incidents reported in Columbus, GA
Something went wrong! Please refresh the page.
| Fire incidents reported | |
|---|---|
| Sreet name | Count |
| CUSSETA RD | 432 |
| VICTORY DR | 302 |
| WARM SPRINGS RD | 280 |
| BUENA VISTA RD | 258 |
| LUMPKIN RD | 240 |
| VETERANS | 208 |
| MACON RD | 196 |
| MILGEN RD | 178 |
| MANCHESTER EXPY | 154 |
| FARR RD | 146 |
| 3RD AVE | 136 |
| PLATEAU DR | 130 |
| TORCH HILL RD | 130 |
| VICTORY DRIVE | 130 |
| ST MARYS RD | 114 |
| 5TH AVE | 106 |
| RIVER RD | 106 |
| MARTIN LUTHER KING JR BLV | 104 |
| MORRIS RD | 94 |
| FORT BENNING RD | 92 |
| CUSSETA ROAD | 86 |
| OLD CUSSETA RD | 86 |
| BENNING DR | 80 |
| VETERANS PKY | 80 |
| BUENA VISTA ROAD | 78 |
| WHITTLESEY BLVD | 78 |
| BENNING DRIVE | 76 |
| NINA ST | 74 |
| 8TH AVE | 72 |
| HUNTER RD | 72 |
| Other | 6,132 |
2006 - 2018 National Fire Incident Reporting System (NFIRS) incidents
- Incident types reported to NFIRS in Columbus, GA
- 62,16068.1%Rescue & EMS
- 10,45011.4%Fire
- 6,6427.3%False Alarm
- 5,9926.6%Hazardous Condition
- 3,4653.8%Good Intent Call
- 2,3032.5%Service Call
- 1510.2%Special Incident
- 940.1%Severe Weather
- Fire incident types reported to NFIRS in Columbus, GA
- 4,62544.3%Outside Fires
- 3,43832.9%Structure Fires
- 1,88618.0%Mobile Property/Vehicle Fires
- 5014.8%Other
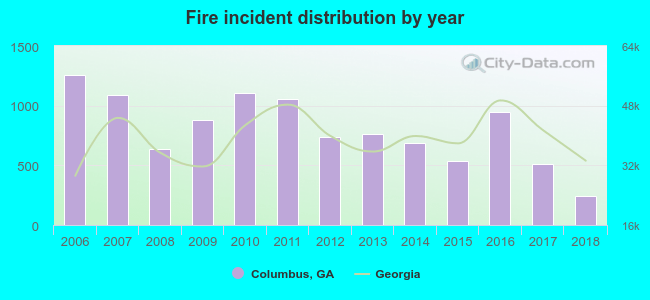 According to the data from the years 2006 - 2018 the average number of fires per year is 804. The highest number of reported fire incidents - 1,257 took place in 2006, and the least - 247 in 2018. The data has a decreasing trend.
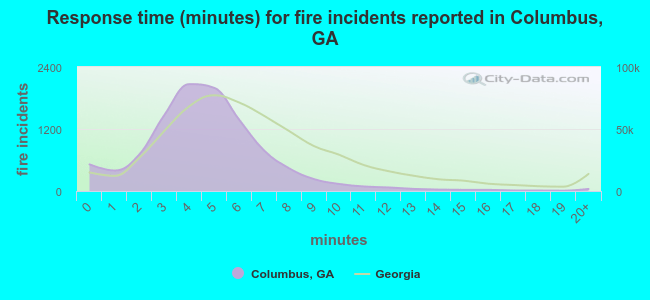 The median response time based on all reported fire incidents is 5 minutes. This is lower compared to the Georgia median value.
The median response time in Columbus, GA compared to nearest cities:
(Note: Based on data for all years, including only cities with at least 500 fire incidents)
| Columbus: | 5 minutes |
| Phenix City: | 4 minutes |
| Smiths: | 8 minutes |
| Pine Mountain: | 8 minutes |
| Valley: | 6 minutes |
| Opelika: | 4 minutes |
| West Point: | 6 minutes |
| Auburn: | 5 minutes |
| LaGrange: | 6 minutes |
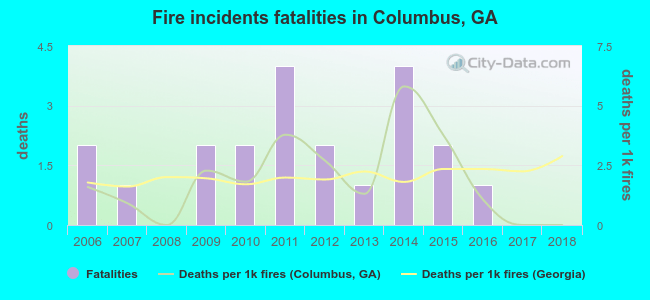 According to the data from the years 2006 - 2018 the average number of fire-related fatalities per year is 2. The highest number of deaths - 4 took place in 2011, and the lowest - 0 in 2008. The data has a dropping trend.
The average number of deaths per 1,000 fires is 2. This indicator was the highest - 6 in 2014, and the lowest 0 in 2008. The trend for deaths per 1,000 fires is declining. Compared to the Georgia value the number of deaths per 1,000 fire incidents is about the same.
According to the data from the years 2006 - 2018 the average number of fire-related fatalities per year is 2. The highest number of deaths - 4 took place in 2011, and the lowest - 0 in 2008. The data has a dropping trend.
The average number of deaths per 1,000 fires is 2. This indicator was the highest - 6 in 2014, and the lowest 0 in 2008. The trend for deaths per 1,000 fires is declining. Compared to the Georgia value the number of deaths per 1,000 fire incidents is about the same.Deaths per 1,000 incidents in Columbus, GA compared to nearest cities:
(Note: Based on data for all years, including only cities with at least 2,500 fire incidents)
| Columbus: | 2.0 |
| Phenix City: | 2.5 |
| LaGrange: | 1.9 |
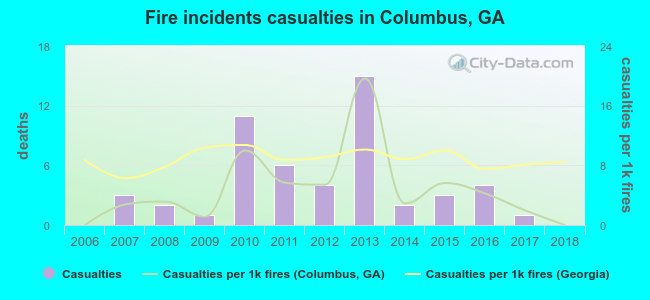 According to the data from the years 2006 - 2018 the average number of fire-related yearly casualties is 4. The highest number of reported casualties - 15 took place in 2013, and the lowest - 0 in 2006. The data has a constant trend.
The average number of casualties per 1,000 fires is 5. This indicator was the highest - 20 in 2013, and the lowest 0 in 2006. The trend for casualties per 1,000 fires is constant. Compared to the state value the number of casualties per 1,000 fire incidents is lower.
According to the data from the years 2006 - 2018 the average number of fire-related yearly casualties is 4. The highest number of reported casualties - 15 took place in 2013, and the lowest - 0 in 2006. The data has a constant trend.
The average number of casualties per 1,000 fires is 5. This indicator was the highest - 20 in 2013, and the lowest 0 in 2006. The trend for casualties per 1,000 fires is constant. Compared to the state value the number of casualties per 1,000 fire incidents is lower.Casualties per 1,000 incidents in Columbus, GA compared to nearest cities:
(Note: Based on data for all years, including only cities with at least 500 fire incidents)
| Columbus: | 5.0 |
| Phenix City: | 3.6 |
| Smiths: | 2.0 |
| Pine Mountain: | 1.7 |
| Valley: | 8.9 |
| Opelika: | 7.6 |
| West Point: | 7.3 |
| Auburn: | 0.8 |
| LaGrange: | 9.4 |
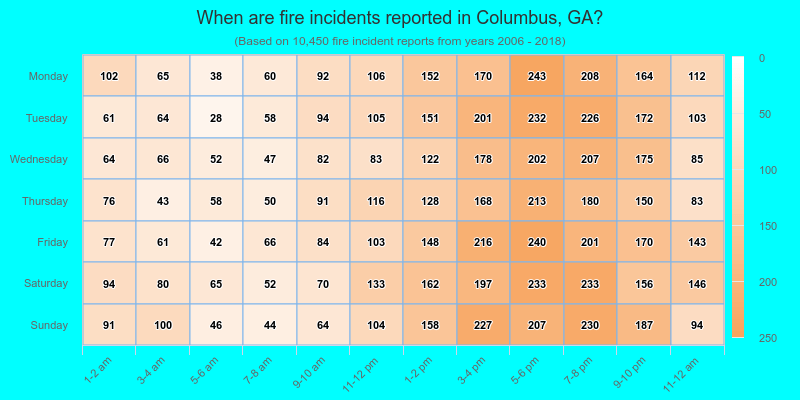
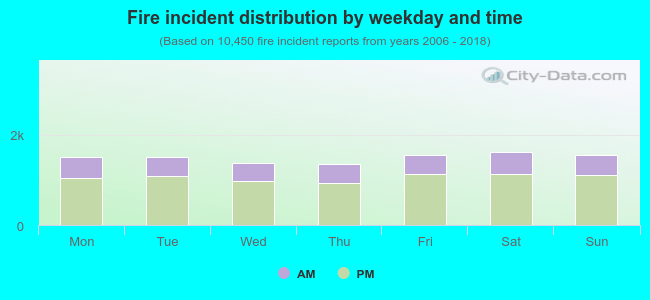 29.4% incidents where reported in the morning and 70.6% in the evening. The most fires (15.5%) took place on Saturday, and the least (13.0%) on Thursday.
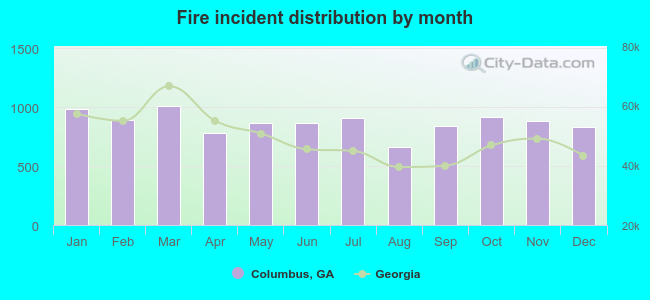 According to the 10,450 fires from years 2006 - 2018 most fires (9.7%) took place during March, and the least (6.3%) in August.
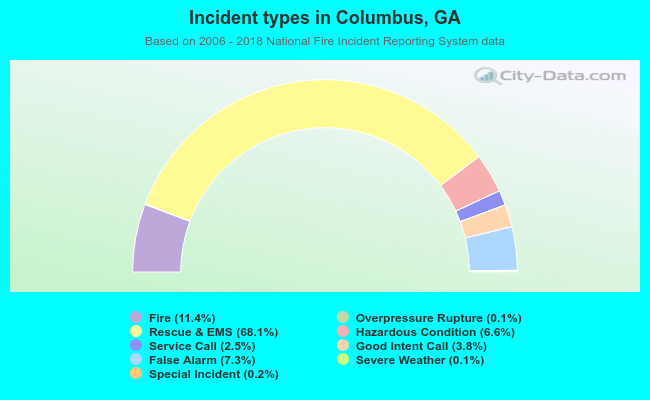 Out of all 91,308 cases reported during the years 2006 - 2018, the most belonged to the categories: Rescue & EMS (68.1%), Fire (11.4%), and False Alarm (7.3%).
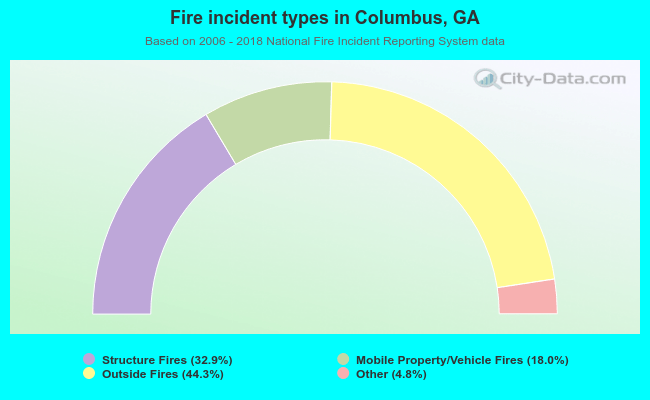 When looking into fire subcategories, the most incidents belonged to: Outside Fires (44.3%), and Structure Fires (32.9%).