Ladue: Fire Incidents, Missouri (MO)
Where are fire incidents reported in Ladue, MO
Something went wrong! Please refresh the page.
|
| |||||||||||||||||||||||||||||||||||||||||||||||||||||||||||||||||||||||||||||||||||||||||||||||||||||||||||||
| Other | 48 | |||||||||||||||||||||||||||||||||||||||||||||||||||||||||||||||||||||||||||||||||||||||||||||||||||||||||||||
2002 - 2018 National Fire Incident Reporting System (NFIRS) incidents
- Incident types reported to NFIRS in Ladue, MO
- 3,25238.2%Rescue & EMS
- 1,52117.9%False Alarm
- 1,36216.0%Good Intent Call
- 1,14213.4%Hazardous Condition
- 5896.9%Service Call
- 5786.8%Fire
- 360.4%Special Incident
- 270.3%Overpressure Rupture
- Fire incident types reported to NFIRS in Ladue, MO
- 35761.8%Structure Fires
- 9015.6%Mobile Property/Vehicle Fires
- 8013.8%Outside Fires
- 518.8%Other
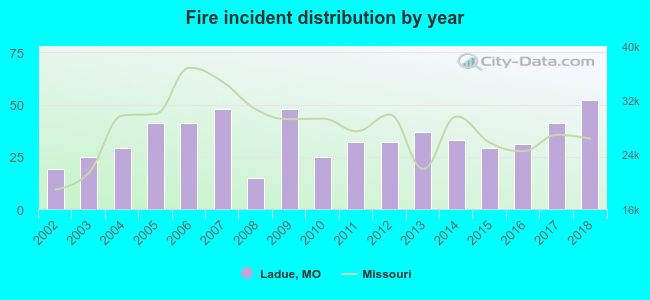 According to the data from the years 2002 - 2018 the average number of fire incidents per year is 34. The highest number of reported fire incidents - 52 took place in 2018, and the least - 15 in 2008. The data has a growing trend.
The average number of yearly fire incidents per 10k residents in Ladue, MO compared to nearest cities:
(Note: Based on data for the last 3 years, including only cities with population 5,000 and above)
| Ladue: | 48.2 |
| Brentwood: | 51.4 |
| Olivette: | 45.9 |
| Clayton: | 43.4 |
| Richmond Heights: | 78.9 |
| Glendale: | 11.3 |
| University City: | 47.4 |
| Maplewood: | 75.0 |
| Webster Groves: | 24.9 |
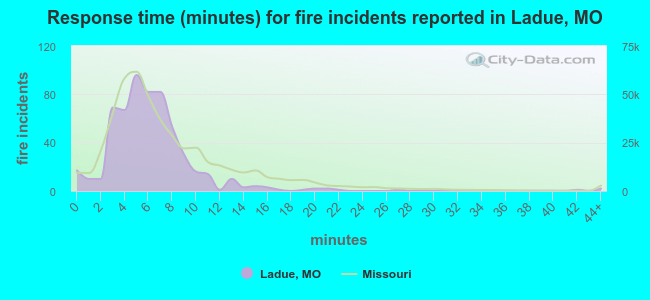 The median response time based on all reported fire incidents is 6 minutes. This is comparable to the Missouri median value.
The median response time in Ladue, MO compared to nearest cities:
(Note: Based on data for all years, including only cities with at least 500 fire incidents)
| Ladue: | 6 minutes |
| Brentwood: | 4 minutes |
| Olivette: | 5 minutes |
| Clayton: | 4 minutes |
| Richmond Heights: | 5 minutes |
| University City: | 5 minutes |
| Maplewood: | 4 minutes |
| Webster Groves: | 5 minutes |
| Creve Coeur: | 6 minutes |
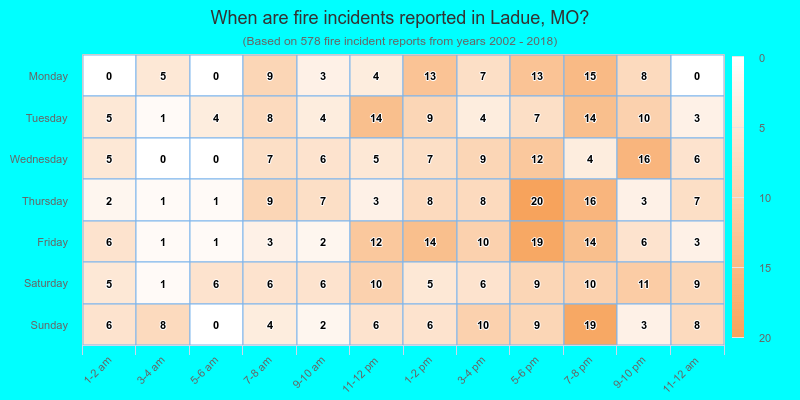
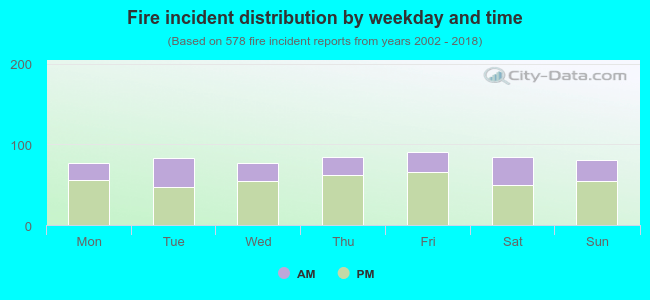 32.5% incidents where reported in the morning and 67.5% in the evening. The most fires (15.7%) took place on Friday, and the least (13.3%) on Monday.
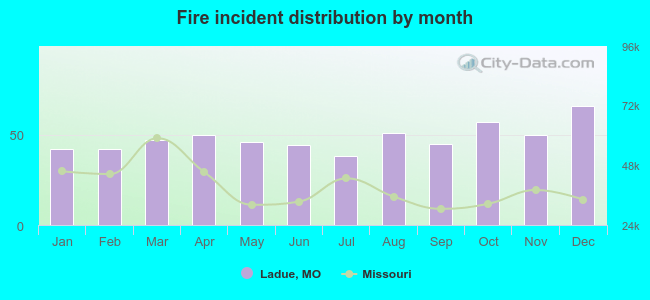 According to the 578 fire incident reports from years 2002 - 2018 most fires (11.4%) took place during December, and the least (6.6%) in July.
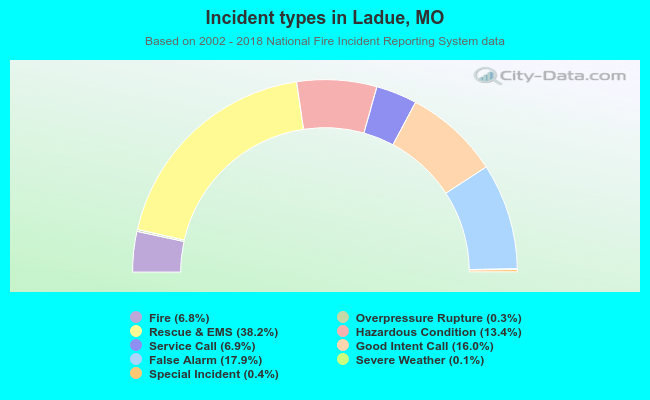 Out of all 8,515 cases reported during the years 2002 - 2018, the most belonged to the categories: Rescue & EMS (38.2%), False Alarm (17.9%), and Good Intent Call (16.0%).
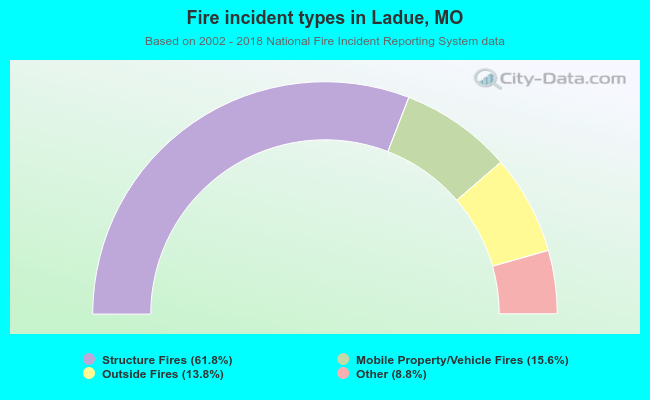 When looking into fire subcategories, the most incidents belonged to: Structure Fires (61.8%), and Mobile Property/Vehicle Fires (15.6%).