Webster Groves: Fire Incidents, Missouri (MO)
Where are fire incidents reported in Webster Groves, MO
Something went wrong! Please refresh the page.
| Fire incidents reported | |
|---|---|
| Sreet name | Count |
| OLD ORCHARD AVE | 168 |
| LOCKWOOD AVE | 114 |
| ELM AVE | 112 |
| BIG BEND BLVD | 104 |
| LACLEDE STATION RD | 100 |
| OLD ORCHARD | 68 |
| WATSON RD | 58 |
| GORE AVE | 54 |
| ATALANTA AVE | 48 |
| OAKWOOD AVE | 44 |
| MARSHALL AVE | 42 |
| FOREST AVE | 40 |
| GREELEY AVE | 38 |
| EDGAR RD | 32 |
| ELM | 32 |
| LOCKWOOD | 32 |
| KIRKHAM AVE | 30 |
| GLENDALE RD | 28 |
| HOLLAND AVE | 28 |
| FAIRVIEW AVE | 24 |
| INTERSTATE 44 HIGHWAY | 24 |
| ROCK HILL RD | 24 |
| CORNELL AVE | 22 |
| INTERSTATE 44 | 22 |
| SELMA AVE | 22 |
| TUXEDO BLVD | 22 |
| JACKSON RD | 20 |
| CLARK AVE | 18 |
| GLEN RD | 18 |
| GORE | 18 |
| Other | 263 |
2002 - 2018 National Fire Incident Reporting System (NFIRS) incidents
- Incident types reported to NFIRS in Webster Groves, MO
- 3,05034.5%Rescue & EMS
- 2,06823.4%Hazardous Condition
- 1,66918.9%Fire
- 93710.6%Good Intent Call
- 7368.3%False Alarm
- 3654.1%Service Call
- 90.1%Severe Weather
- Fire incident types reported to NFIRS in Webster Groves, MO
- 1,06663.9%Structure Fires
- 25015.0%Outside Fires
- 22113.2%Other
- 1327.9%Mobile Property/Vehicle Fires
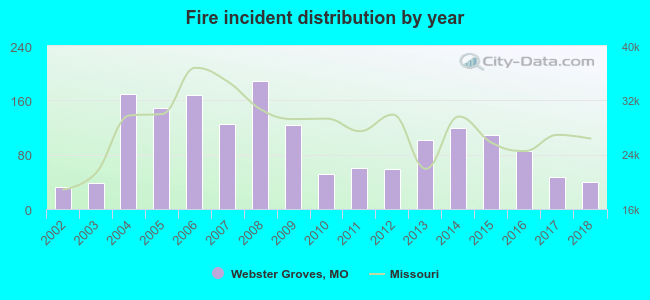 Based on the data from the years 2002 - 2018 the average number of fires per year is 98. The highest number of reported fire incidents - 188 took place in 2008, and the least - 33 in 2002. The data has a growing trend.
The average number of yearly fire incidents per 10k residents in Webster Groves, MO compared to nearest cities:
(Note: Based on data for the last 3 years, including only cities with population 5,000 and above)
| Webster Groves: | 24.9 |
| Shrewsbury: | 28.5 |
| Glendale: | 11.3 |
| Brentwood: | 51.4 |
| Crestwood: | 22.6 |
| Maplewood: | 75.0 |
| Affton: | 8.9 |
| Richmond Heights: | 78.9 |
| Kirkwood: | 26.6 |
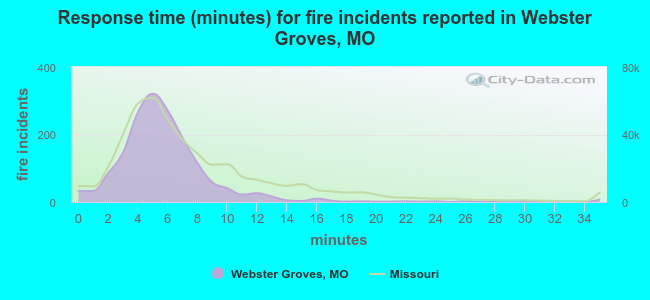 The median response time based on all reported fire incidents is 5 minutes. This is lower compared to the Missouri median value.
The median response time in Webster Groves, MO compared to nearest cities:
(Note: Based on data for all years, including only cities with at least 500 fire incidents)
| Webster Groves: | 5 minutes |
| Shrewsbury: | 5 minutes |
| Brentwood: | 4 minutes |
| Crestwood: | 4 minutes |
| Maplewood: | 4 minutes |
| Affton: | 5 minutes |
| Richmond Heights: | 5 minutes |
| Kirkwood: | 5 minutes |
| Ladue: | 6 minutes |
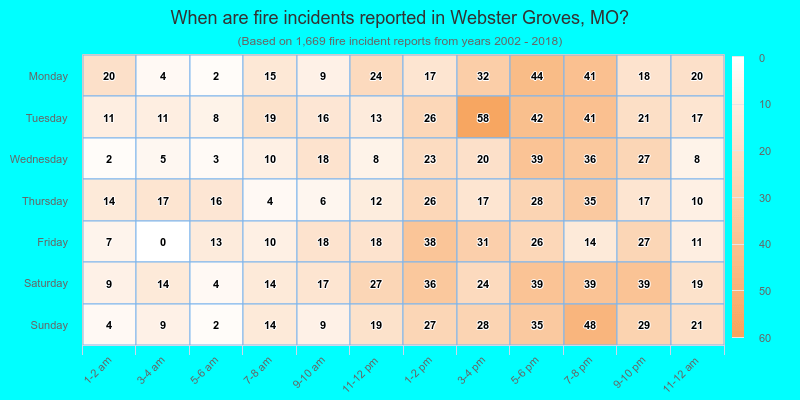
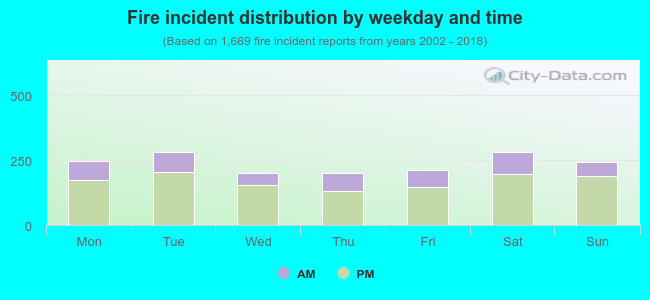 28.5% incidents where reported in the morning and 71.5% in the evening. The most fires (17.0%) took place on Tuesday, and the least (11.9%) on Wednesday.
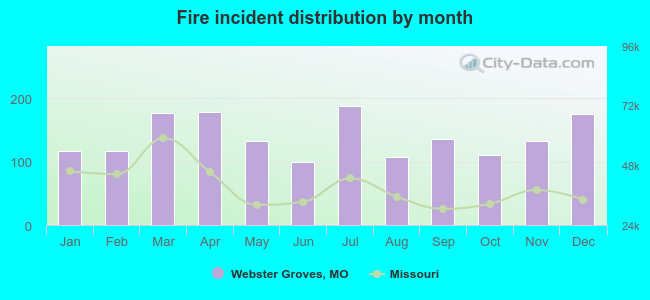 Based on the 1,669 fire incident reports from years 2002 - 2018 most fires (11.3%) took place during July, and the least (5.9%) in June.
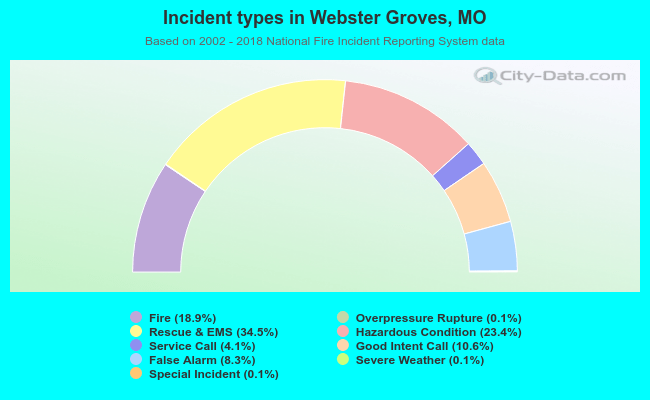 Out of all 8,846 cases reported during the years 2002 - 2018, the most belonged to the categories: Rescue & EMS (34.5%), Hazardous Condition (23.4%), and Fire (18.9%).
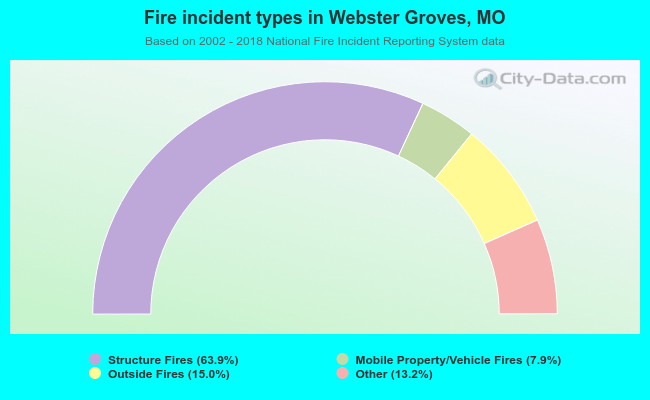 When looking into fire subcategories, the most reports belonged to: Structure Fires (63.9%), and Outside Fires (15.0%).