Lafayette: Fire Incidents, Indiana (IN)
Where are fire incidents reported in Lafayette, IN
Something went wrong! Please refresh the page.
| Fire incidents reported | |
|---|---|
| Sreet name | Count |
| SAGAMORE PKY | 142 |
| 9TH ST | 124 |
| VETERANS MEMORIAL PKY S | 106 |
| 18TH ST | 102 |
| MAIN ST | 92 |
| 4TH ST | 82 |
| SOUTH ST | 80 |
| UNION ST | 76 |
| CREASY LN | 72 |
| GREENBUSH ST | 70 |
| SAGAMORE PKY S | 68 |
| TEAL RD | 62 |
| FERRY ST | 60 |
| ELIZABETH ST | 54 |
| STATE RD 26 | 54 |
| 6TH ST | 52 |
| SCHUYLER AVE | 52 |
| I65 S | 50 |
| 2ND ST | 48 |
| 5TH ST | 48 |
| BECK LN | 46 |
| 19TH ST | 44 |
| 800 RD | 44 |
| STATE RD 38 | 44 |
| 7TH ST | 42 |
| 8TH ST | 42 |
| STATE RD 38 E | 42 |
| WABASH AVE | 40 |
| 500 RD | 38 |
| I65 N | 38 |
| Other | 1,699 |
2002 - 2017 National Fire Incident Reporting System (NFIRS) incidents
- Incident types reported to NFIRS in Lafayette, IN
- 8,62449.1%Rescue & EMS
- 3,61320.6%Fire
- 2,93516.7%Hazardous Condition
- 9515.4%Good Intent Call
- 6773.9%Service Call
- 6373.6%False Alarm
- 630.4%Special Incident
- 280.2%Overpressure Rupture
- 190.1%Severe Weather
- Fire incident types reported to NFIRS in Lafayette, IN
- 1,37238.0%Outside Fires
- 1,36337.7%Structure Fires
- 62317.2%Mobile Property/Vehicle Fires
- 2557.1%Other
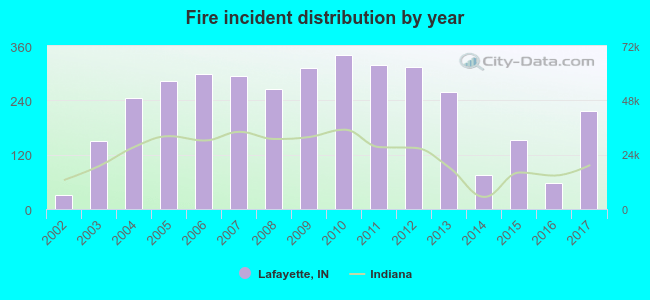 Based on the data from the years 2002 - 2017 the average number of fires per year is 226. The highest number of reported fire incidents - 340 took place in 2010, and the least - 32 in 2002. The data has an increasing trend.
The average number of yearly fire incidents per 10k residents in Lafayette, IN compared to nearest cities:
(Note: Based on data for the last 3 years, including only cities with population 5,000 and above)
| Lafayette: | 13.1 |
| West Lafayette: | 30.1 |
| Frankfort: | 19.8 |
| Monticello: | 20.6 |
| Crawfordsville: | 5.3 |
| Lebanon: | 10.9 |
| Logansport: | 29.1 |
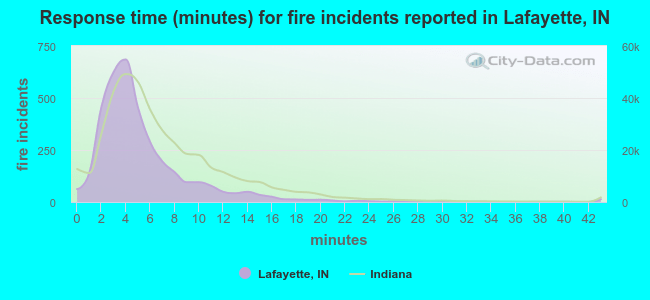 The median response time based on all reported fire incidents is 4 minutes. This is lower than the Indiana median value.
The median response time in Lafayette, IN compared to nearest cities:
(Note: Based on data for all years, including only cities with at least 500 fire incidents)
| Lafayette: | 4 minutes |
| West Lafayette: | 4 minutes |
| Delphi: | 9 minutes |
| Frankfort: | 6 minutes |
| Attica: | 10 minutes |
| Monticello: | 7 minutes |
| Crawfordsville: | 5 minutes |
| Lebanon: | 5 minutes |
| Logansport: | 4 minutes |
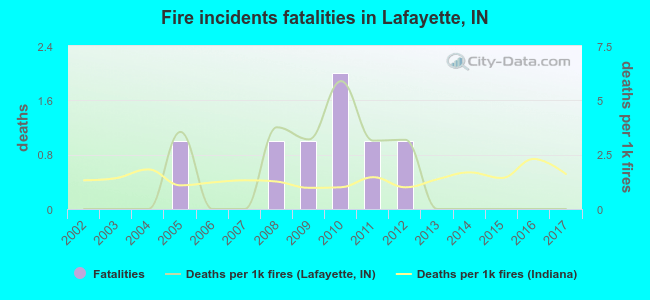 Based on the reports from the years 2002 - 2017 the average number of fire-related fatalities per year is 0. The highest number of deaths - 2 took place in 2010, and the lowest - 0 in 2002. The data has a constant trend.
The average number of fatalities per 1,000 fire incidents is 1. This indicator was the highest - 6 in 2010, and the lowest 0 in 2002. The trend for fatalities per 1,000 fire incidents is declining. Compared to the Indiana value the number of fatalities per 1,000 fire incidents is higher.
Based on the reports from the years 2002 - 2017 the average number of fire-related fatalities per year is 0. The highest number of deaths - 2 took place in 2010, and the lowest - 0 in 2002. The data has a constant trend.
The average number of fatalities per 1,000 fire incidents is 1. This indicator was the highest - 6 in 2010, and the lowest 0 in 2002. The trend for fatalities per 1,000 fire incidents is declining. Compared to the Indiana value the number of fatalities per 1,000 fire incidents is higher.Deaths per 1,000 incidents in Lafayette, IN compared to nearest cities:
(Note: Based on data for all years, including only cities with at least 2,500 fire incidents)
| Lafayette: | 1.9 |
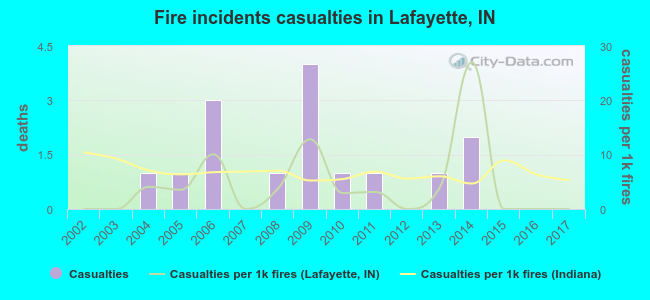 Based on the data from the years 2002 - 2017 the average number of fire-related yearly casualties is 1. The highest number of reported casualties - 4 took place in 2009, and the lowest - 0 in 2002. The data has a constant trend.
The average number of injuries per 1,000 fires is 4. This indicator was the highest - 27 in 2014, and the lowest 0 in 2002. The trend for injuries per 1,000 fire incidents is constant. Compared to the Indiana value the number of casualties per 1,000 incidents is lower.
Based on the data from the years 2002 - 2017 the average number of fire-related yearly casualties is 1. The highest number of reported casualties - 4 took place in 2009, and the lowest - 0 in 2002. The data has a constant trend.
The average number of injuries per 1,000 fires is 4. This indicator was the highest - 27 in 2014, and the lowest 0 in 2002. The trend for injuries per 1,000 fire incidents is constant. Compared to the Indiana value the number of casualties per 1,000 incidents is lower.Casualties per 1,000 incidents in Lafayette, IN compared to nearest cities:
(Note: Based on data for all years, including only cities with at least 500 fire incidents)
| Lafayette: | 4.2 |
| West Lafayette: | 1.9 |
| Delphi: | 24.8 |
| Frankfort: | 1.7 |
| Attica: | 0.0 |
| Monticello: | 17.3 |
| Crawfordsville: | 14.4 |
| Lebanon: | 16.4 |
| Logansport: | 1.1 |
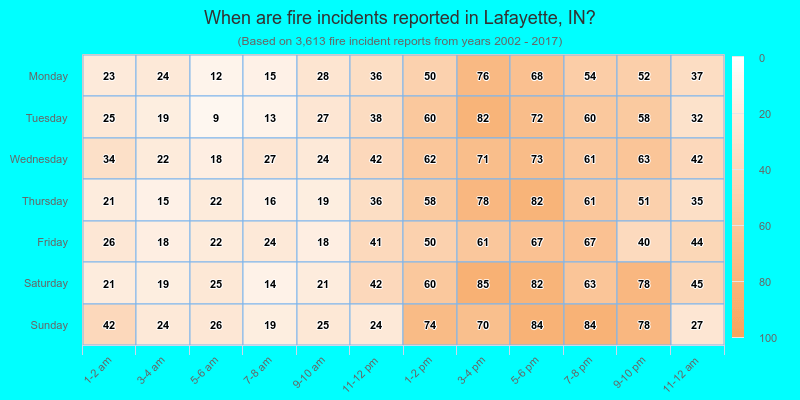
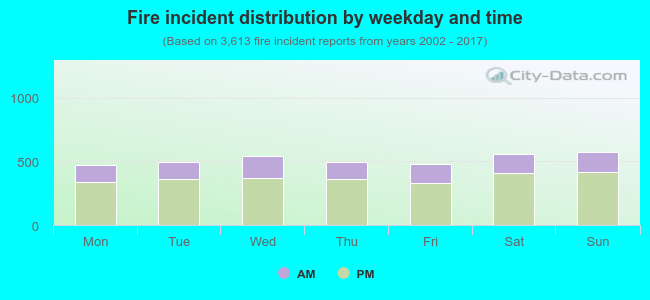 28.1% incidents where reported in the morning and 71.9% in the evening. The most fires (16.0%) took place on Sunday, and the least (13.1%) on Monday.
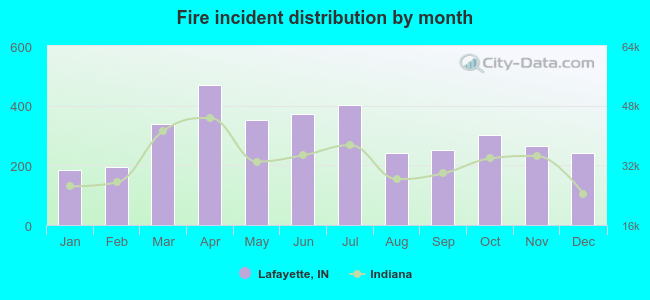 According to the 3,613 incident reports from years 2002 - 2017 most fires (13.0%) took place during April, and the least (5.1%) in January.
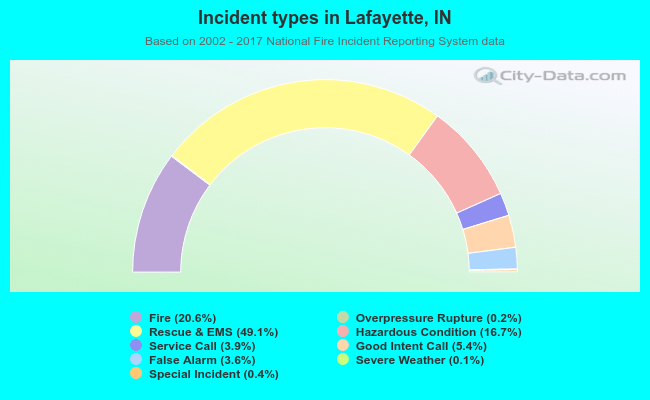 Out of all 17,547 cases reported during the years 2002 - 2017, the most belonged to the categories: Rescue & EMS (49.1%), Fire (20.6%), and Hazardous Condition (16.7%).
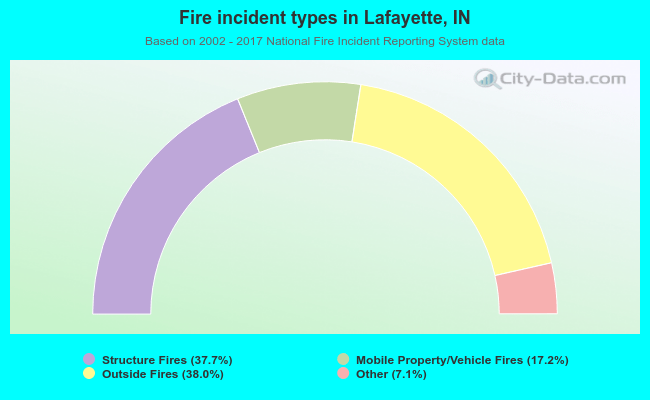 When looking into fire subcategories, the most incidents belonged to: Outside Fires (38.0%), and Structure Fires (37.7%).