Lebanon: Fire Incidents, Indiana (IN)
Where are fire incidents reported in Lebanon, IN
Something went wrong! Please refresh the page.
| Fire incidents reported | |
|---|---|
| Sreet name | Count |
| LEBANON ST | 174 |
| EAST ST | 128 |
| LAFAYETTE AVE | 120 |
| WASHINGTON ST | 80 |
| MAIN ST | 66 |
| ELM ST | 62 |
| MERIDIAN ST | 62 |
| GRANT ST | 54 |
| ELIZAVILLE RD | 48 |
| SOUTH ST | 46 |
| INDIANAPOLIS RD | 40 |
| NOBLE ST | 40 |
| STATE ROAD 267 | 38 |
| I-65 | 36 |
| INDIANAPOLIS AVE | 36 |
| MT ZION RD | 34 |
| WEST ST | 32 |
| MM I-65 | 30 |
| ST RD 39 | 30 |
| ENTERPRISE BLVD | 28 |
| INTERSTATE 65 | 28 |
| SR 32 | 28 |
| 500 | 26 |
| I65 | 26 |
| PEARL ST | 26 |
| ST RD 32 | 26 |
| INTERSTATE 65 HWY | 24 |
| BECK ST | 22 |
| NORTH ST | 22 |
| PATTERSON ST | 22 |
| Other | 455 |
2002 - 2017 National Fire Incident Reporting System (NFIRS) incidents
- Incident types reported to NFIRS in Lebanon, IN
- 1,88936.6%Fire
- 1,32025.6%Hazardous Condition
- 74714.5%Rescue & EMS
- 4909.5%Good Intent Call
- 4298.3%Service Call
- 2494.8%False Alarm
- 180.3%Special Incident
- 130.3%Overpressure Rupture
- 110.2%Severe Weather
- Fire incident types reported to NFIRS in Lebanon, IN
- 82743.8%Outside Fires
- 63633.7%Structure Fires
- 28815.2%Mobile Property/Vehicle Fires
- 1387.3%Other
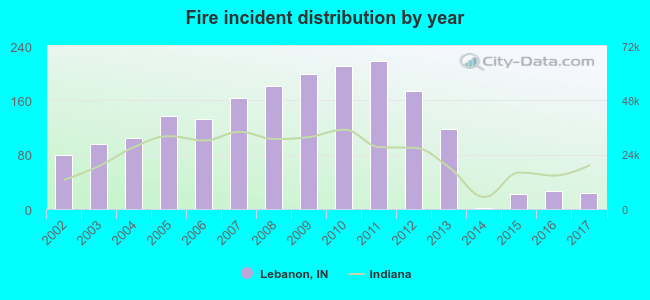 According to the data from the years 2002 - 2017 the average number of fire incidents per year is 118. The highest number of reported fires - 218 took place in 2011, and the least - 2 in 2014. The data has a dropping trend.
The average number of yearly fire incidents per 10k residents in Lebanon, IN compared to nearest cities:
(Note: Based on data for the last 3 years, including only cities with population 5,000 and above)
| Lebanon: | 10.9 |
| Whitestown: | 40.6 |
| Zionsville: | 16.1 |
| Brownsburg: | 19.2 |
| Frankfort: | 19.8 |
| Westfield: | 17.8 |
| Carmel: | 2.9 |
| Danville: | 44.1 |
| Avon: | 44.2 |
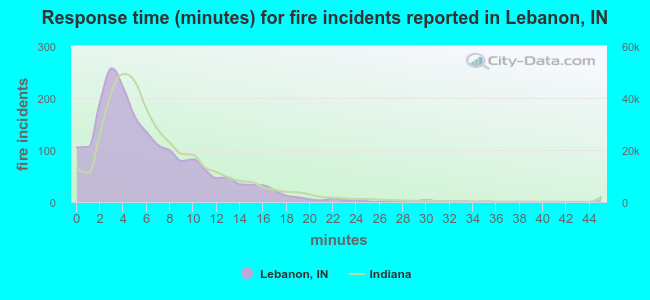 The median response time based on all reported fire incidents is 5 minutes. This is lower than the state median value.
The median response time in Lebanon, IN compared to nearest cities:
(Note: Based on data for all years, including only cities with at least 500 fire incidents)
| Lebanon: | 5 minutes |
| Zionsville: | 6 minutes |
| Sheridan: | 8 minutes |
| Brownsburg: | 6 minutes |
| Frankfort: | 6 minutes |
| Westfield: | 7 minutes |
| Carmel: | 6 minutes |
| Danville: | 8 minutes |
| Avon: | 7 minutes |
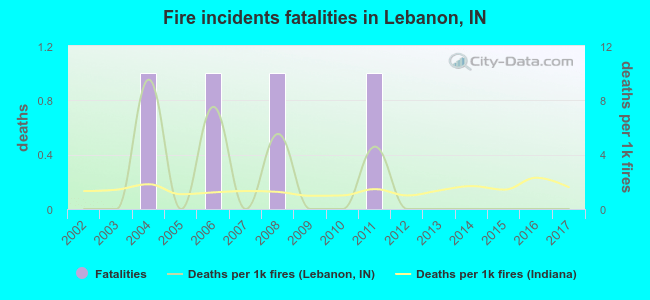 According to the reports from the years 2002 - 2017 the average number of fire-related yearly deaths is 0. The highest number of reported deaths - 1 took place in 2004, and the lowest - 0 in 2002. The data has a constant trend.
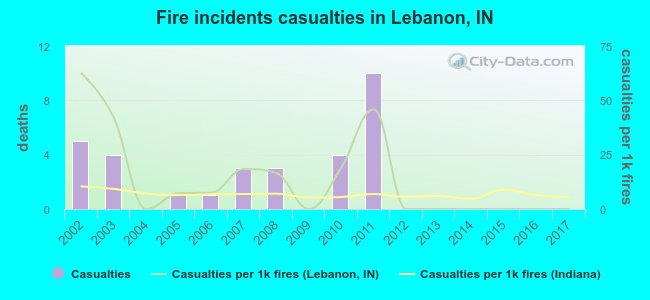 Based on the data from the years 2002 - 2017 the average number of fire-related casualties per year is 2. The highest number of casualties - 10 took place in 2011, and the lowest - 0 in 2004. The data has a decreasing trend.
The average number of injuries per 1,000 fire incidents is 14. This indicator was the highest - 63 in 2002, and the lowest 0 in 2004. The trend for injuries per 1,000 fires is decreasing. Compared to the Indiana value the number of injuries per 1,000 fires is much higher.
Based on the data from the years 2002 - 2017 the average number of fire-related casualties per year is 2. The highest number of casualties - 10 took place in 2011, and the lowest - 0 in 2004. The data has a decreasing trend.
The average number of injuries per 1,000 fire incidents is 14. This indicator was the highest - 63 in 2002, and the lowest 0 in 2004. The trend for injuries per 1,000 fires is decreasing. Compared to the Indiana value the number of injuries per 1,000 fires is much higher.Casualties per 1,000 incidents in Lebanon, IN compared to nearest cities:
(Note: Based on data for all years, including only cities with at least 500 fire incidents)
| Lebanon: | 16.4 |
| Zionsville: | 0.9 |
| Sheridan: | 4.3 |
| Brownsburg: | 22.5 |
| Frankfort: | 1.7 |
| Westfield: | 26.5 |
| Carmel: | 13.3 |
| Danville: | 0.9 |
| Avon: | 2.4 |
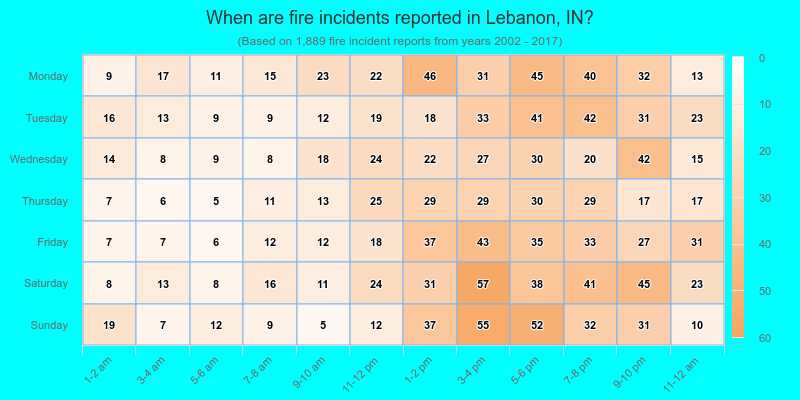
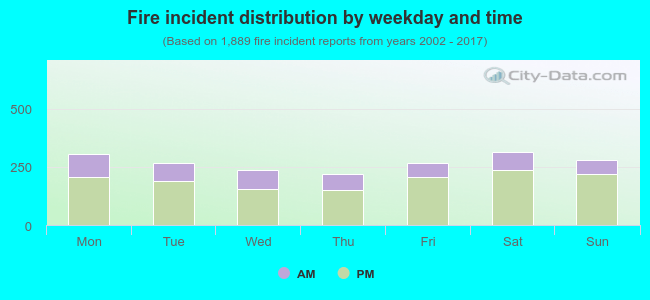 28.0% incidents where reported in the morning and 72.0% in the evening. The most fires (16.7%) took place on Saturday, and the least (11.5%) on Thursday.
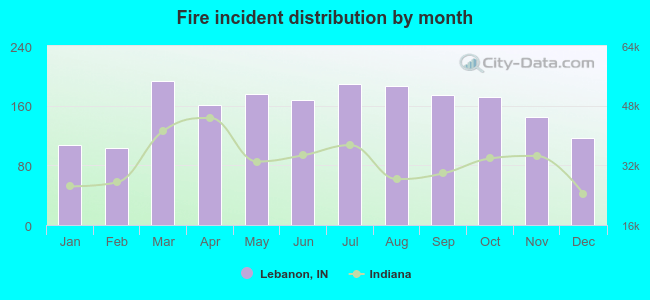 Based on the 1,889 fire incidents from years 2002 - 2017 most fires (10.2%) took place during March, and the least (5.5%) in February.
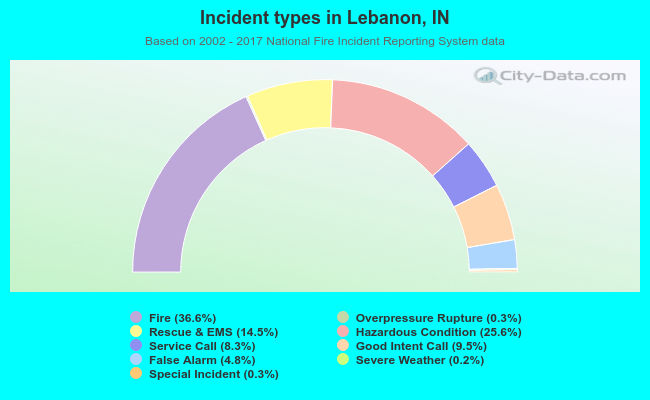 Out of all 5,166 cases reported during the years 2002 - 2017, the most belonged to the categories: Fire (36.6%), Hazardous Condition (25.6%), and Rescue & EMS (14.5%).
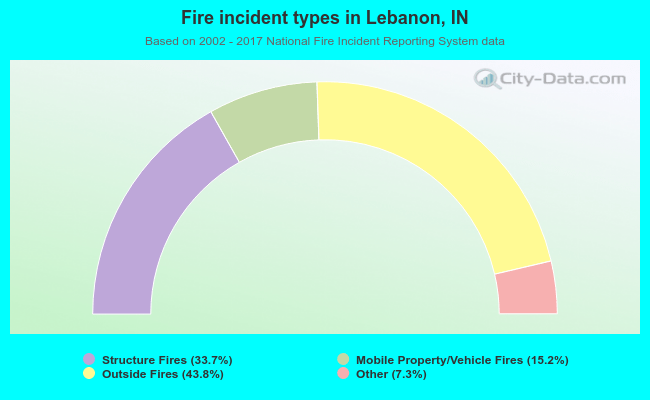 When looking into fire subcategories, the most incidents belonged to: Outside Fires (43.8%), and Structure Fires (33.7%).