Lakewood: Fire Incidents, Ohio (OH)
Where are fire incidents reported in Lakewood, OH
Something went wrong! Please refresh the page.
| Fire incidents reported | |
|---|---|
| Sreet name | Count |
| DETROIT AVE | 680 |
| MADISON AVE | 424 |
| EDGEWATER DR | 322 |
| CLIFTON BLVD | 230 |
| LAKE AVE | 228 |
| BUNTS RD | 132 |
| WARREN RD | 94 |
| NEWMAN AVE | 76 |
| CLARENCE AVE | 64 |
| HILLIARD RD | 56 |
| LAKELAND AVE | 56 |
| SLOANE AVE | 56 |
| FRANKLIN BLVD | 54 |
| RIDGEWOOD AVE | 46 |
| COVE AVE | 44 |
| ELBUR AVE | 42 |
| WEST 117 ST | 42 |
| WATERBURY RD | 40 |
| LEWIS DR | 38 |
| ROBINWOOD AVE | 38 |
| ATHENS AVE | 36 |
| BELLE AVE | 36 |
| DELAWARE AVE | 36 |
| LAKEWOOD AVE | 36 |
| LINCOLN AVE | 36 |
| MARS AVE | 36 |
| MARLOWE AVE | 34 |
| WINCHESTER AVE | 34 |
| BEREA RD | 32 |
| CORDOVA AVE | 32 |
2002 - 2018 National Fire Incident Reporting System (NFIRS) incidents
- Incident types reported to NFIRS in Lakewood, OH
- 11,94843.6%Rescue & EMS
- 7,72928.2%Hazardous Condition
- 2,4609.0%Fire
- 2,2928.4%Service Call
- 1,9127.0%False Alarm
- 9233.4%Good Intent Call
- 690.3%Special Incident
- 320.1%Overpressure Rupture
- Fire incident types reported to NFIRS in Lakewood, OH
- 1,59064.6%Structure Fires
- 60724.7%Outside Fires
- 24910.1%Mobile Property/Vehicle Fires
- 140.6%Other
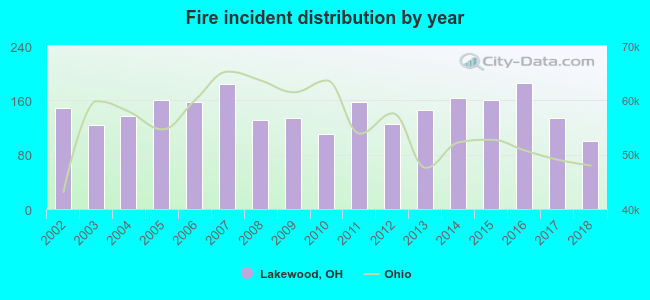 According to the data from the years 2002 - 2018 the average number of fires per year is 145. The highest number of fires - 185 took place in 2016, and the least - 100 in 2018. The data has a dropping trend.
The average number of yearly fire incidents per 10k residents in Lakewood, OH compared to nearest cities:
(Note: Based on data for the last 3 years, including only cities with population 5,000 and above)
| Lakewood: | 27.4 |
| Rocky River: | 30.0 |
| Fairview Park: | 33.2 |
| Brooklyn: | 42.3 |
| Brook Park: | 25.1 |
| Bay Village: | 21.8 |
| Cleveland: | 6.9 |
| Parma Heights: | 23.9 |
| Westlake: | 30.5 |
 The median response time based on all reported fire incidents is 4 minutes. This is lower than the state median value.
The median response time in Lakewood, OH compared to nearest cities:
(Note: Based on data for all years, including only cities with at least 500 fire incidents)
| Lakewood: | 4 minutes |
| Rocky River: | 5 minutes |
| Fairview Park: | 5 minutes |
| Brooklyn: | 4 minutes |
| Brook Park: | 5 minutes |
| Bay Village: | 5 minutes |
| Cleveland: | 5 minutes |
| Parma Heights: | 3 minutes |
| Westlake: | 6 minutes |
 According to the reports from the years 2002 - 2018 the average number of fire-related yearly deaths is 0. The highest number of reported deaths - 2 took place in 2010, and the lowest - 0 in 2002. The data has a constant trend.
 Based on the data from the years 2002 - 2018 the average number of fire-related yearly casualties is 5. The highest number of injuries - 9 took place in 2002, and the lowest - 1 in 2015. The data has a constant trend.
The average number of injuries per 1,000 fires is 35. This indicator was the highest - 90 in 2018, and the lowest 6 in 2015. The trend for casualties per 1,000 incidents is rising. Compared to the state value the number of casualties per 1,000 fire incidents is much higher.
Based on the data from the years 2002 - 2018 the average number of fire-related yearly casualties is 5. The highest number of injuries - 9 took place in 2002, and the lowest - 1 in 2015. The data has a constant trend.
The average number of injuries per 1,000 fires is 35. This indicator was the highest - 90 in 2018, and the lowest 6 in 2015. The trend for casualties per 1,000 incidents is rising. Compared to the state value the number of casualties per 1,000 fire incidents is much higher.Casualties per 1,000 incidents in Lakewood, OH compared to nearest cities:
(Note: Based on data for all years, including only cities with at least 500 fire incidents)
| Lakewood: | 33.3 |
| Rocky River: | 13.3 |
| Fairview Park: | 7.1 |
| Brooklyn: | 6.3 |
| Brook Park: | 25.0 |
| Bay Village: | 9.0 |
| Cleveland: | 17.3 |
| Parma Heights: | 43.3 |
| Westlake: | 27.5 |
 31.9% incidents where reported in the morning and 68.1% in the evening. The most fires (15.7%) took place on Saturday, and the least (12.9%) on Wednesday.
 Based on the 2,460 fire incidents from years 2002 - 2018 most fires (11.1%) took place during July, and the least (6.0%) in February.
 Out of all 27,381 cases reported during the years 2002 - 2018, the most belonged to the categories: Rescue & EMS (43.6%), Hazardous Condition (28.2%), and Fire (9.0%).
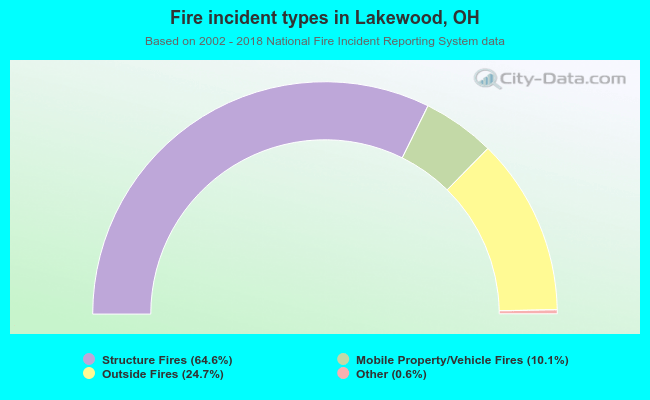 When looking into fire subcategories, the most reports belonged to: Structure Fires (64.6%), and Outside Fires (24.7%).