Brooklyn: Fire Incidents, Ohio (OH)
Where are fire incidents reported in Brooklyn, OH
Something went wrong! Please refresh the page.
| Fire incidents reported | |
|---|---|
| Sreet name | Count |
| RIDGE RD | 226 |
| MEMPHIS AVE | 166 |
| TIEDEMAN RD | 116 |
| BROOKPARK RD | 114 |
| BIDDULPH RD | 96 |
| WESTBROOK DR | 58 |
| I-480 WESTBOUND | 50 |
| CLINTON RD | 48 |
| I-480 EASTBOUND | 42 |
| NORTHCLIFF AVE | 28 |
| NORTHRIDGE OVAL | 20 |
| CASCADE CROSSING | 18 |
| IDLEWOOD DR | 16 |
| I480 EASTBOUND | 14 |
| I480 WESTBOUND | 14 |
| IRA AVE | 14 |
| RIDGE | 14 |
| ROADOAN RD | 14 |
| WESTBROOK | 12 |
| AMERICAN RD | 10 |
| I-71 NORTHBOUND | 10 |
| I-71 SOUTHBOUND | 10 |
| N AMBER | 10 |
| OUTLOOK AVE | 10 |
| SPRING CREST DR | 10 |
| TRAYMORE AVE | 10 |
| ANSONIA AVE | 8 |
| BEECH AVE | 8 |
| CASCADE XING | 8 |
| CLINTON | 8 |
2002 - 2018 National Fire Incident Reporting System (NFIRS) incidents
- Incident types reported to NFIRS in Brooklyn, OH
- 2,79541.2%Rescue & EMS
- 1,34919.9%Hazardous Condition
- 96214.2%False Alarm
- 79711.8%Fire
- 5067.5%Good Intent Call
- 3244.8%Service Call
- 370.5%Special Incident
- 70.1%Severe Weather
- Fire incident types reported to NFIRS in Brooklyn, OH
- 34543.3%Structure Fires
- 25532.0%Outside Fires
- 18222.8%Mobile Property/Vehicle Fires
- 151.9%Other
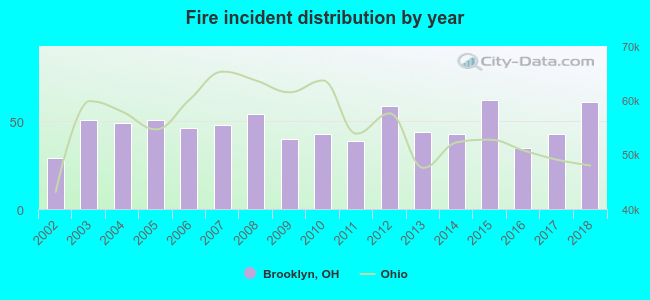 Based on the data from the years 2002 - 2018 the average number of fire incidents per year is 47. The highest number of reported fires - 62 took place in 2015, and the least - 29 in 2002. The data has a rising trend.
The average number of yearly fire incidents per 10k residents in Brooklyn, OH compared to nearest cities:
(Note: Based on data for the last 3 years, including only cities with population 5,000 and above)
| Brooklyn: | 42.3 |
| Parma: | 21.2 |
| Parma Heights: | 23.9 |
| Lakewood: | 27.4 |
| Brook Park: | 25.1 |
| Seven Hills: | 23.6 |
| Cleveland: | 6.9 |
| Middleburg Heights: | 26.2 |
| Fairview Park: | 33.2 |
 The median response time based on all reported fire incidents is 4 minutes. This is lower than the state median value.
The median response time in Brooklyn, OH compared to nearest cities:
(Note: Based on data for all years, including only cities with at least 500 fire incidents)
| Brooklyn: | 4 minutes |
| Parma: | 4 minutes |
| Parma Heights: | 3 minutes |
| Lakewood: | 4 minutes |
| Brook Park: | 5 minutes |
| Cleveland: | 5 minutes |
| Fairview Park: | 5 minutes |
| Rocky River: | 5 minutes |
| Independence: | 6 minutes |
 According to the reports from the years 2002 - 2018 the average number of fire-related casualties per year is 0. The highest number of reported casualties - 2 took place in 2003, and the lowest - 0 in 2002. The data has an increasing trend.
The average number of injuries per 1,000 fires is 5. This indicator was the highest - 39 in 2003, and the lowest 0 in 2002. The trend for injuries per 1,000 fires is increasing. Compared to the Ohio value the number of injuries per 1,000 fires is much lower.
According to the reports from the years 2002 - 2018 the average number of fire-related casualties per year is 0. The highest number of reported casualties - 2 took place in 2003, and the lowest - 0 in 2002. The data has an increasing trend.
The average number of injuries per 1,000 fires is 5. This indicator was the highest - 39 in 2003, and the lowest 0 in 2002. The trend for injuries per 1,000 fires is increasing. Compared to the Ohio value the number of injuries per 1,000 fires is much lower.Casualties per 1,000 incidents in Brooklyn, OH compared to nearest cities:
(Note: Based on data for all years, including only cities with at least 500 fire incidents)
| Brooklyn: | 6.3 |
| Parma: | 19.1 |
| Parma Heights: | 43.3 |
| Lakewood: | 33.3 |
| Brook Park: | 25.0 |
| Cleveland: | 17.3 |
| Fairview Park: | 7.1 |
| Rocky River: | 13.3 |
| Independence: | 8.2 |
 33.0% incidents where reported in the morning and 67.0% in the evening. The most fires (16.8%) took place on Monday, and the least (11.3%) on Thursday.
 According to the 797 fire incidents from years 2002 - 2018 most fires (12.2%) took place during July, and the least (4.6%) in February.
 Out of all 6,780 cases reported during the years 2002 - 2018, the most belonged to the categories: Rescue & EMS (41.2%), Hazardous Condition (19.9%), and False Alarm (14.2%).
 When looking into fire subcategories, the most reports belonged to: Structure Fires (43.3%), and Outside Fires (32.0%).