Lambertville: Fire Incidents, Michigan (MI)
Where are fire incidents reported in Lambertville, MI
Something went wrong! Please refresh the page.
|
| |||||||||||||||||||||||||||||||||||||||||||||||||||||||||||||||||||||||||||||||||||||||||||||||||||||||||||||
2002 - 2018 National Fire Incident Reporting System (NFIRS) incidents
- Incident types reported to NFIRS in Lambertville, MI
- 2,86161.6%Rescue & EMS
- 55411.9%Service Call
- 3928.4%Good Intent Call
- 3577.7%Fire
- 3186.8%Hazardous Condition
- 1352.9%False Alarm
- 250.5%Severe Weather
- Fire incident types reported to NFIRS in Lambertville, MI
- 19955.7%Structure Fires
- 11131.1%Outside Fires
- 3910.9%Mobile Property/Vehicle Fires
- 82.2%Other
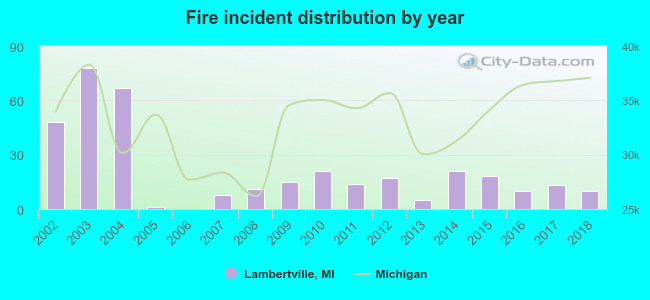 According to the data from the years 2002 - 2018 the average number of fires per year is 21. The highest number of fire incidents - 78 took place in 2003, and the least - 0 in 2006. The data has a dropping trend.
The average number of yearly fire incidents per 10k residents in Lambertville, MI compared to nearest cities:
(Note: Based on data for the last 3 years, including only cities with population 5,000 and above)
| Lambertville: | 11.1 |
| Temperance: | 59.1 |
| Monroe: | 93.1 |
| Milan: | 71.1 |
| Adrian: | 73.3 |
| Tecumseh: | 26.2 |
| Flat Rock: | 39.2 |
| Saline: | 48.4 |
| Woodhaven: | 25.9 |
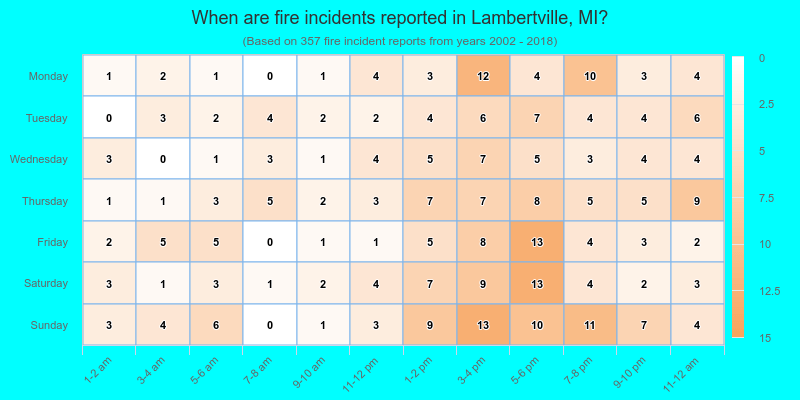
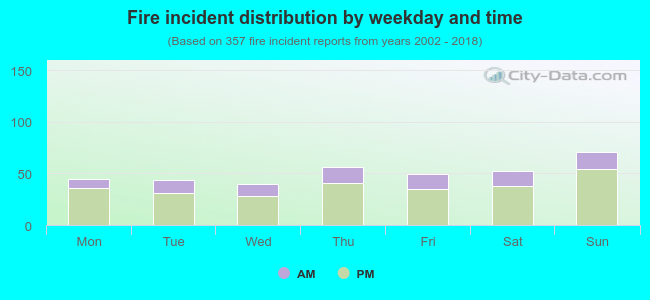 26.3% incidents where reported in the morning and 73.7% in the evening. The most fires (19.9%) took place on Sunday, and the least (11.2%) on Wednesday.
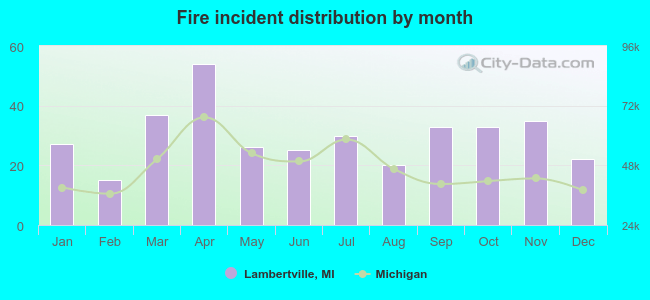 Based on the 357 fires from years 2002 - 2018 most fires (15.1%) took place during April, and the least (4.2%) in February.
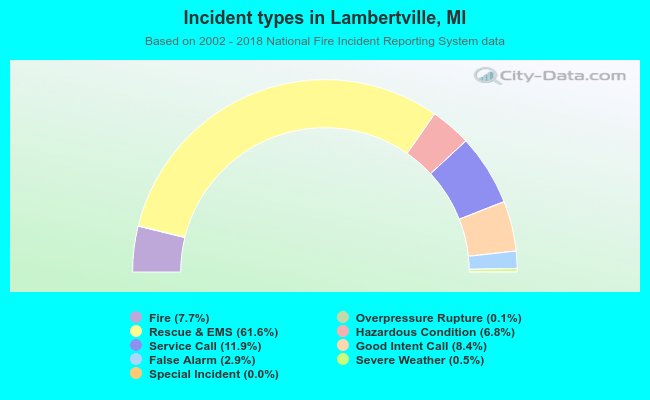 Out of all 4,646 cases reported during the years 2002 - 2018, the most belonged to the categories: Rescue & EMS (61.6%), Service Call (11.9%), and Good Intent Call (8.4%).
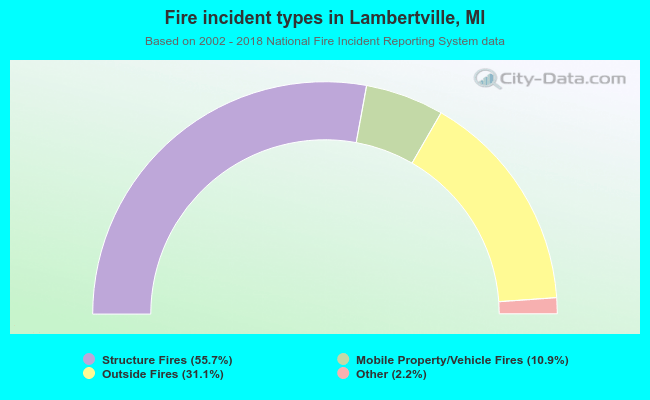 When looking into fire subcategories, the most incidents belonged to: Structure Fires (55.7%), and Outside Fires (31.1%).