Adrian: Fire Incidents, Michigan (MI)
Where are fire incidents reported in Adrian, MI
Something went wrong! Please refresh the page.
| Fire incidents reported | |
|---|---|
| Sreet name | Count |
| MAIN | 162 |
| ADRIAN HWY | 130 |
| MAUMEE | 120 |
| TREAT HWY | 90 |
| BEECHER | 82 |
| WINTER | 76 |
| CARLETON RD | 66 |
| US-223 | 60 |
| MICHIGAN | 58 |
| SAND CREEK HWY | 58 |
| WOLF CREEK HWY | 46 |
| GADY RD | 44 |
| MAUMEE ST | 44 |
| SHEPHERD RD | 44 |
| US223 HWY | 44 |
| BROAD | 42 |
| GORMAN RD | 42 |
| COLLEGE AVE | 38 |
| DIVISION | 38 |
| HUNT RD | 38 |
| CADMUS RD | 36 |
| MAIN ST | 36 |
| RIVERSIDE AVE | 36 |
| BENT OAK HWY | 34 |
| CARSON HWY | 32 |
| CHURCH | 32 |
| SUTTON RD | 32 |
| DOROTHY ST | 30 |
| ERIE | 30 |
| HUNT | 30 |
| Other | 474 |
2002 - 2018 National Fire Incident Reporting System (NFIRS) incidents
- Incident types reported to NFIRS in Adrian, MI
- 15,26061.7%Rescue & EMS
- 2,4149.8%Hazardous Condition
- 2,1248.6%Fire
- 1,9708.0%Good Intent Call
- 1,8057.3%Service Call
- 7883.2%False Alarm
- 2671.1%Severe Weather
- 700.3%Special Incident
- Fire incident types reported to NFIRS in Adrian, MI
- 80137.7%Outside Fires
- 76035.8%Structure Fires
- 29013.7%Other
- 27312.9%Mobile Property/Vehicle Fires
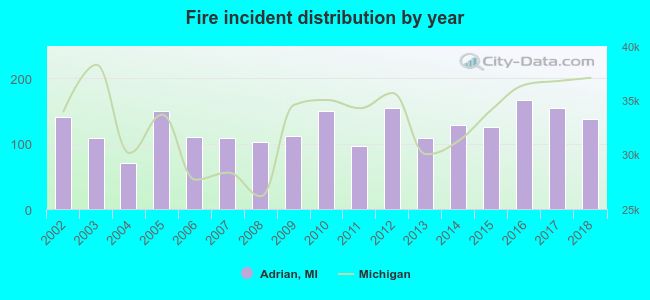 Based on the data from the years 2002 - 2018 the average number of fire incidents per year is 125. The highest number of fires - 166 took place in 2016, and the least - 71 in 2004. The data has a decreasing trend.
The average number of yearly fire incidents per 10k residents in Adrian, MI compared to nearest cities:
(Note: Based on data for the last 3 years, including only cities with population 5,000 and above)
| Adrian: | 73.3 |
| Tecumseh: | 26.2 |
| Milan: | 71.1 |
| Saline: | 48.4 |
| Lambertville: | 11.1 |
| Temperance: | 59.1 |
| Chelsea: | 85.7 |
| Ann Arbor: | 29.5 |
| Jackson: | 120.5 |
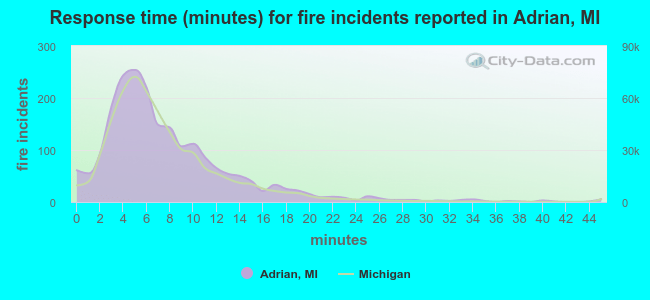 The median response time based on all reported fire incidents is 6 minutes. This is about the same as the state median value.
The median response time in Adrian, MI compared to nearest cities:
(Note: Based on data for all years, including only cities with at least 500 fire incidents)
| Adrian: | 6 minutes |
| Tecumseh: | 8 minutes |
| Onsted: | 11 minutes |
| Manchester: | 11 minutes |
| Brooklyn: | 8 minutes |
| Milan: | 10 minutes |
| Saline: | 6 minutes |
| Temperance: | 6 minutes |
| Chelsea: | 8 minutes |
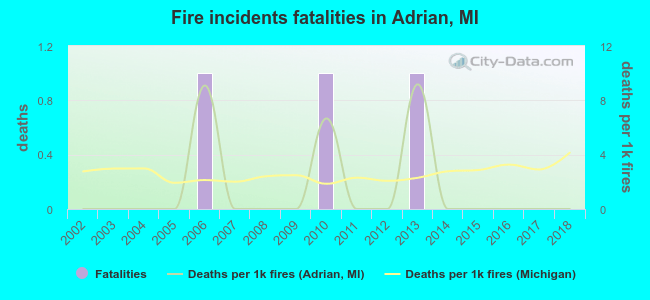 Based on the data from the years 2002 - 2018 the average number of fire-related yearly deaths is 0. The highest number of deaths - 1 took place in 2006, and the lowest - 0 in 2002. The data has a constant trend.
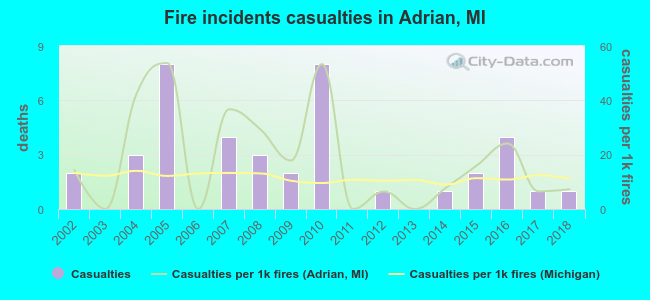 According to the reports from the years 2002 - 2018 the average number of fire-related yearly casualties is 2. The highest number of injuries - 8 took place in 2005, and the lowest - 0 in 2003. The data has a dropping trend.
The average number of injuries per 1,000 fire incidents is 19. This indicator was the highest - 54 in 2005, and the lowest 0 in 2003. The trend for casualties per 1,000 fire incidents is decreasing. Compared to the state value the number of casualties per 1,000 fires is higher.
According to the reports from the years 2002 - 2018 the average number of fire-related yearly casualties is 2. The highest number of injuries - 8 took place in 2005, and the lowest - 0 in 2003. The data has a dropping trend.
The average number of injuries per 1,000 fire incidents is 19. This indicator was the highest - 54 in 2005, and the lowest 0 in 2003. The trend for casualties per 1,000 fire incidents is decreasing. Compared to the state value the number of casualties per 1,000 fires is higher.Casualties per 1,000 incidents in Adrian, MI compared to nearest cities:
(Note: Based on data for all years, including only cities with at least 500 fire incidents)
| Adrian: | 18.8 |
| Tecumseh: | 11.5 |
| Onsted: | 3.8 |
| Manchester: | 6.2 |
| Brooklyn: | 16.4 |
| Milan: | 7.8 |
| Saline: | 1.9 |
| Temperance: | 16.2 |
| Chelsea: | 2.8 |
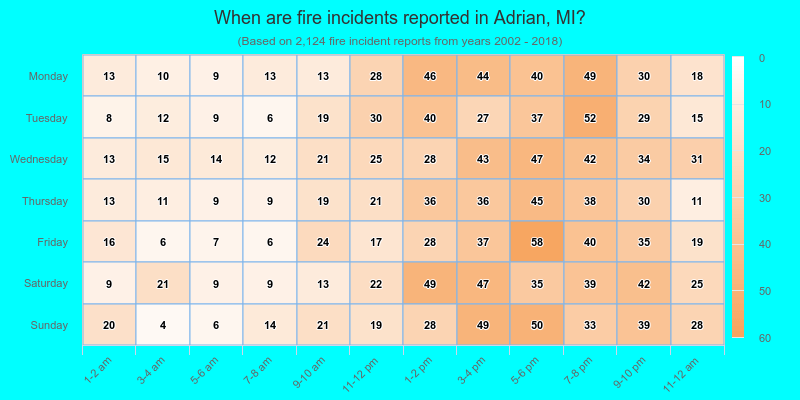
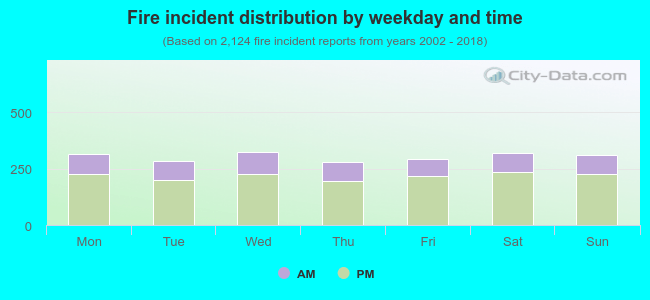 28.0% incidents where reported in the morning and 72.0% in the evening. The most fires (15.3%) took place on Wednesday, and the least (13.1%) on Thursday.
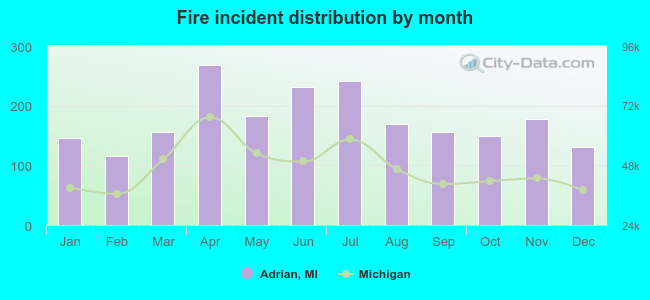 Based on the 2,124 incident reports from years 2002 - 2018 most fires (12.6%) took place during April, and the least (5.5%) in February.
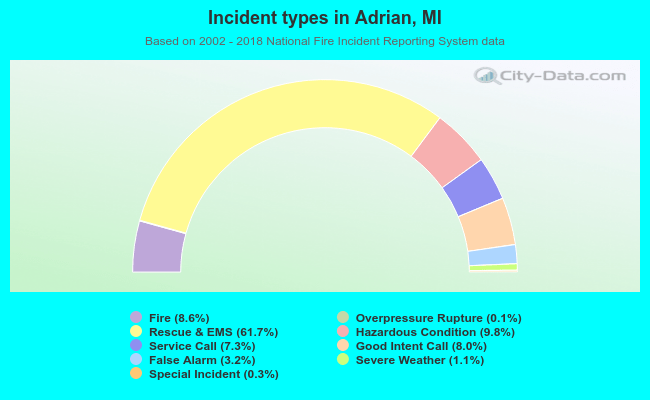 Out of all 24,715 cases reported during the years 2002 - 2018, the most belonged to the categories: Rescue & EMS (61.7%), Hazardous Condition (9.8%), and Fire (8.6%).
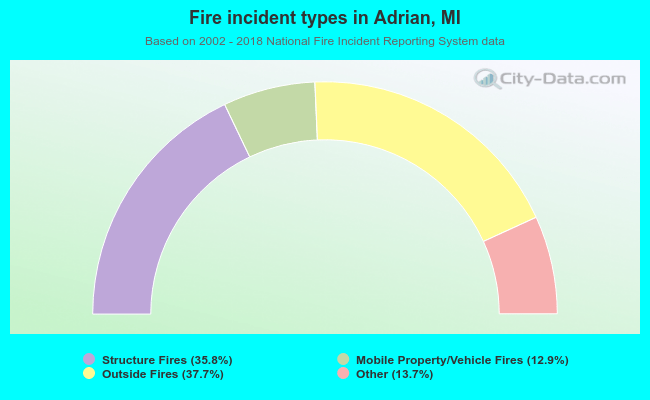 When looking into fire subcategories, the most reports belonged to: Outside Fires (37.7%), and Structure Fires (35.8%).