Lawrence: Fire Incidents, Massachusetts (MA)
Where are fire incidents reported in Lawrence, MA
Something went wrong! Please refresh the page.
| Fire incidents reported | |
|---|---|
| Sreet name | Count |
| HAVERHILL ST | 332 |
| ESSEX ST | 248 |
| WINTHROP AVE | 224 |
| WATER ST | 202 |
| BROADWAY | 192 |
| LAWRENCE ST | 188 |
| BROADWAY ST | 170 |
| ANDOVER ST | 156 |
| LOWELL ST | 148 |
| PARK ST | 148 |
| HAMPSHIRE ST | 136 |
| JACKSON ST | 130 |
| BERNARD AVE | 128 |
| COMMON ST | 128 |
| HANCOCK ST | 120 |
| HIGH ST | 104 |
| SPRINGFIELD ST | 100 |
| HOWARD ST | 90 |
| S UNION ST | 90 |
| UNION ST | 90 |
| MERRIMACK ST | 88 |
| BODWELL ST | 86 |
| NEWBURY ST | 86 |
| FARNHAM ST | 84 |
| BAILEY ST | 74 |
| CANAL ST | 74 |
| SALEM ST | 74 |
| MAGINNIS AVE | 72 |
| MARSTON ST | 72 |
| WEST ST | 72 |
| Other | 1,424 |
2002 - 2018 National Fire Incident Reporting System (NFIRS) incidents
- Incident types reported to NFIRS in Lawrence, MA
- 18,07438.8%Rescue & EMS
- 9,97321.4%False Alarm
- 7,48016.1%Hazardous Condition
- 5,33011.5%Fire
- 2,7786.0%Good Intent Call
- 2,6835.8%Service Call
- 1290.3%Special Incident
- 650.1%Overpressure Rupture
- Fire incident types reported to NFIRS in Lawrence, MA
- 2,60748.9%Structure Fires
- 1,66031.1%Outside Fires
- 89116.7%Mobile Property/Vehicle Fires
- 1723.2%Other
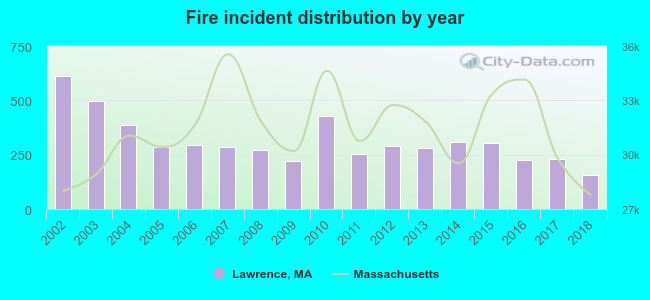 According to the data from the years 2002 - 2018 the average number of fire incidents per year is 314. The highest number of reported fires - 612 took place in 2002, and the least - 155 in 2018. The data has a decreasing trend.
The average number of yearly fire incidents per 10k residents in Lawrence, MA compared to nearest cities:
(Note: Based on data for the last 3 years, including only cities with population 5,000 and above)
| Lawrence: | 26.0 |
| Methuen: | 26.7 |
| North Andover: | 38.9 |
| Andover: | 113.4 |
| Haverhill: | 33.9 |
| Tewksbury: | 29.8 |
| Groveland: | 32.5 |
| Dracut: | 20.3 |
| Lowell: | 41.4 |
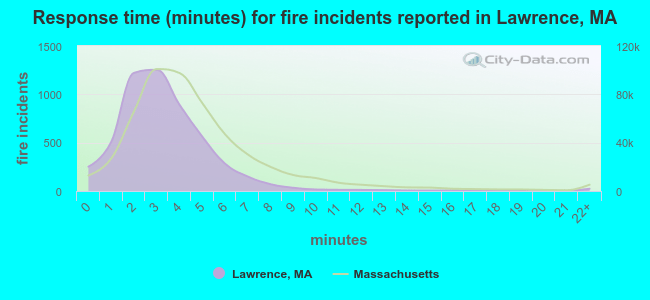 The median response time based on all reported fire incidents is 3 minutes. This is lower compared to the Massachusetts median value.
The median response time in Lawrence, MA compared to nearest cities:
(Note: Based on data for all years, including only cities with at least 500 fire incidents)
| Lawrence: | 3 minutes |
| Methuen: | 4 minutes |
| North Andover: | 4 minutes |
| Andover: | 6 minutes |
| Haverhill: | 4 minutes |
| Tewksbury: | 4 minutes |
| Dracut: | 5 minutes |
| Lowell: | 3 minutes |
| North Reading: | 4 minutes |
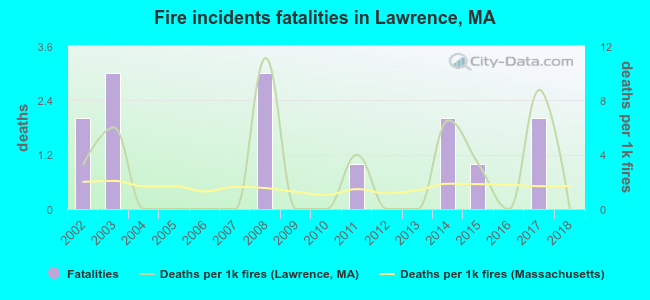 According to the reports from the years 2002 - 2018 the average number of fire-related yearly deaths is 1. The highest number of deaths - 3 took place in 2003, and the lowest - 0 in 2004. The data has a dropping trend.
The average number of fatalities per 1,000 fires is 3. This indicator was the highest - 11 in 2008, and the lowest 0 in 2004. The trend for deaths per 1,000 fire incidents is declining. Compared to the state value the number of deaths per 1,000 fires is higher.
According to the reports from the years 2002 - 2018 the average number of fire-related yearly deaths is 1. The highest number of deaths - 3 took place in 2003, and the lowest - 0 in 2004. The data has a dropping trend.
The average number of fatalities per 1,000 fires is 3. This indicator was the highest - 11 in 2008, and the lowest 0 in 2004. The trend for deaths per 1,000 fire incidents is declining. Compared to the state value the number of deaths per 1,000 fires is higher.
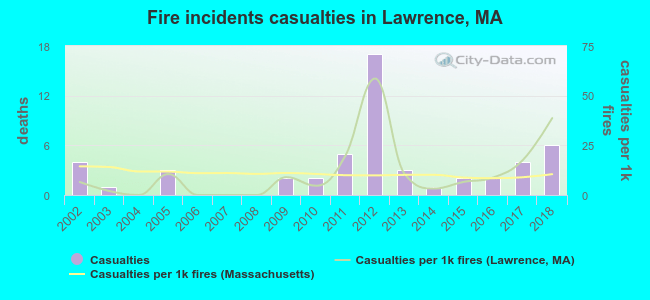 According to the reports from the years 2002 - 2018 the average number of fire-related casualties per year is 3. The highest number of injuries - 17 took place in 2012, and the lowest - 0 in 2004. The data has a rising trend.
The average number of casualties per 1,000 fire incidents is 12. This indicator was the highest - 59 in 2012, and the lowest 0 in 2004. The trend for casualties per 1,000 fires is growing. Compared to the Massachusetts value the number of casualties per 1,000 fire incidents is similar.
According to the reports from the years 2002 - 2018 the average number of fire-related casualties per year is 3. The highest number of injuries - 17 took place in 2012, and the lowest - 0 in 2004. The data has a rising trend.
The average number of casualties per 1,000 fire incidents is 12. This indicator was the highest - 59 in 2012, and the lowest 0 in 2004. The trend for casualties per 1,000 fires is growing. Compared to the Massachusetts value the number of casualties per 1,000 fire incidents is similar.Casualties per 1,000 incidents in Lawrence, MA compared to nearest cities:
(Note: Based on data for all years, including only cities with at least 500 fire incidents)
| Lawrence: | 9.8 |
| Methuen: | 5.0 |
| North Andover: | 5.9 |
| Andover: | 1.0 |
| Haverhill: | 9.9 |
| Tewksbury: | 3.2 |
| Dracut: | 10.9 |
| Lowell: | 5.6 |
| North Reading: | 6.7 |
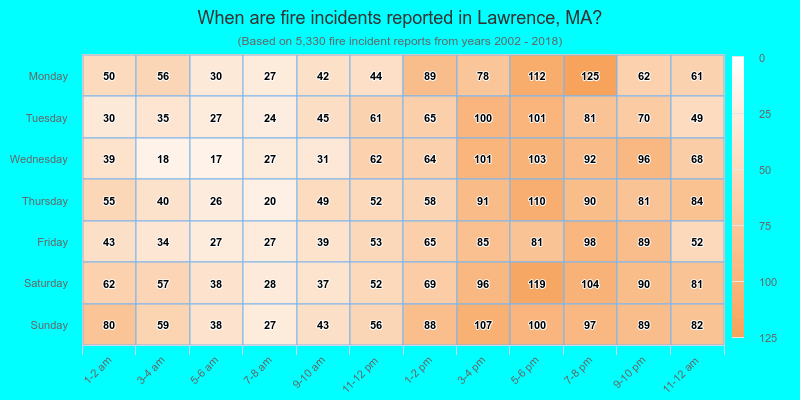
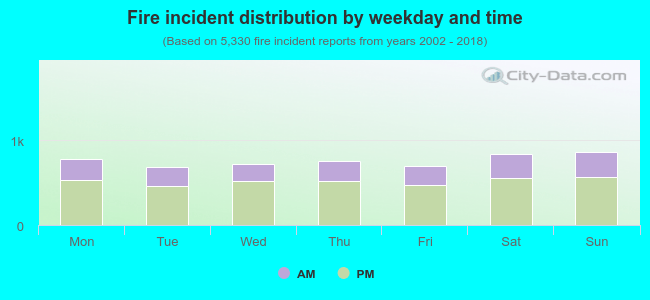 32.0% incidents where reported in the morning and 68.0% in the evening. The most fires (16.2%) took place on Sunday, and the least (12.9%) on Tuesday.
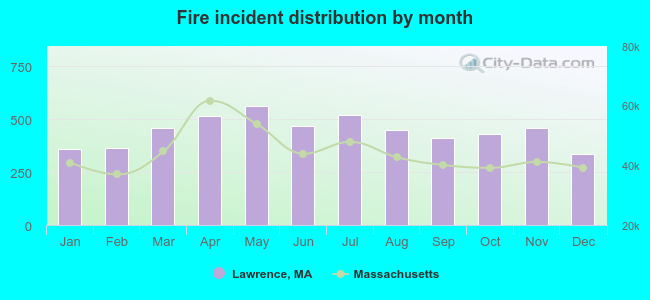 According to the 5,330 fire incidents from years 2002 - 2018 most fires (10.6%) took place during May, and the least (6.3%) in December.
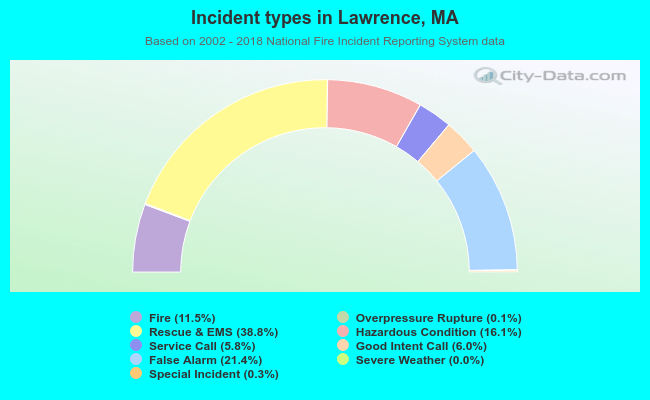 Out of all 46,528 cases reported during the years 2002 - 2018, the most belonged to the categories: Rescue & EMS (38.8%), False Alarm (21.4%), and Hazardous Condition (16.1%).
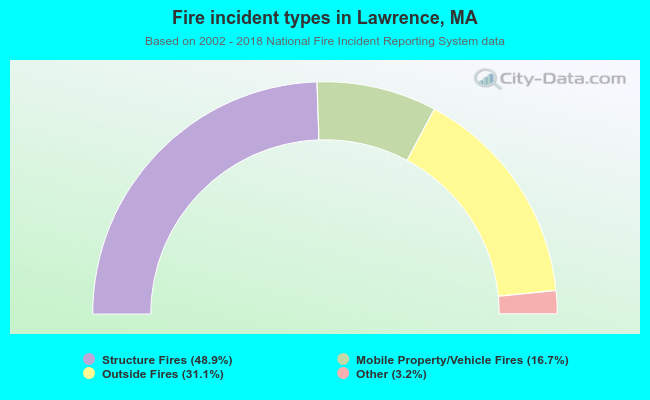 When looking into fire subcategories, the most incidents belonged to: Structure Fires (48.9%), and Outside Fires (31.1%).