Lawton: Fire Incidents, Oklahoma (OK)
Where are fire incidents reported in Lawton, OK
Something went wrong! Please refresh the page.
| Fire incidents reported | |
|---|---|
| Sreet name | Count |
| CACHE RD | 302 |
| LEE BLVD | 280 |
| GORE BLVD | 268 |
| SHERIDAN RD | 212 |
| BISHOP RD | 124 |
| EUCLID AVE | 90 |
| JEFFERSON AVE | 84 |
| FERRIS AVE | 82 |
| OZMUN AVE | 78 |
| 38TH ST | 76 |
| H AVE | 74 |
| OAK AVE | 72 |
| J AVE | 70 |
| ROGERS LANE | 70 |
| G AVE | 66 |
| PARK AVE | 66 |
| E AVE | 64 |
| COLUMBIA AVE | 62 |
| B AVE | 60 |
| BELL AVE | 60 |
| FLOWER MOUND RD | 60 |
| I AVE | 60 |
| 45TH ST | 58 |
| D AVE | 58 |
| LINDY AVE | 58 |
| SUMMIT AVE | 58 |
| 52ND ST | 56 |
| WILLIAMS AVE | 56 |
| C AVE | 54 |
| F AVE | 54 |
| Other | 2,701 |
2002 - 2018 National Fire Incident Reporting System (NFIRS) incidents
- Incident types reported to NFIRS in Lawton, OK
- 26,23354.5%Rescue & EMS
- 5,53311.5%Fire
- 5,19310.8%Service Call
- 4,1448.6%Good Intent Call
- 3,5967.5%False Alarm
- 3,2416.7%Hazardous Condition
- 1140.2%Overpressure Rupture
- 720.1%Special Incident
- Fire incident types reported to NFIRS in Lawton, OK
- 2,88052.1%Outside Fires
- 1,76932.0%Structure Fires
- 64211.6%Mobile Property/Vehicle Fires
- 2424.4%Other
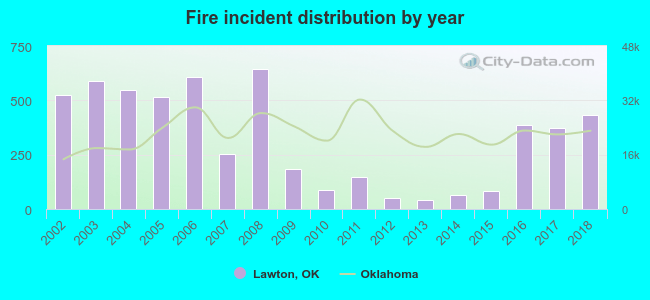 Based on the data from the years 2002 - 2018 the average number of fires per year is 325. The highest number of fire incidents - 643 took place in 2008, and the least - 41 in 2013. The data has a declining trend.
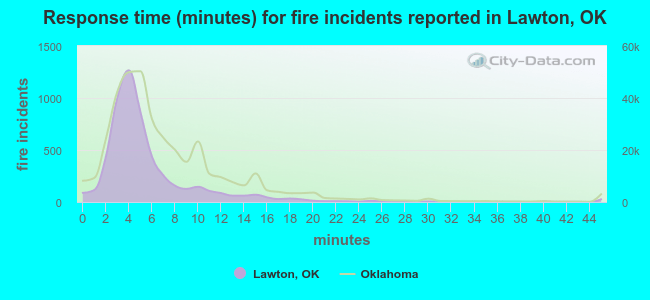 The median response time based on all reported fire incidents is 4 minutes. This is lower than the Oklahoma median value.
The median response time in Lawton, OK compared to nearest cities:
(Note: Based on data for all years, including only cities with at least 500 fire incidents)
| Lawton: | 4 minutes |
| Cache: | 10 minutes |
| Walters: | 9 minutes |
| Apache: | 10 minutes |
| Marlow: | 7 minutes |
| Duncan: | 5 minutes |
| Rush Springs: | 13 minutes |
| Anadarko: | 6 minutes |
| Ninnekah: | 11 minutes |
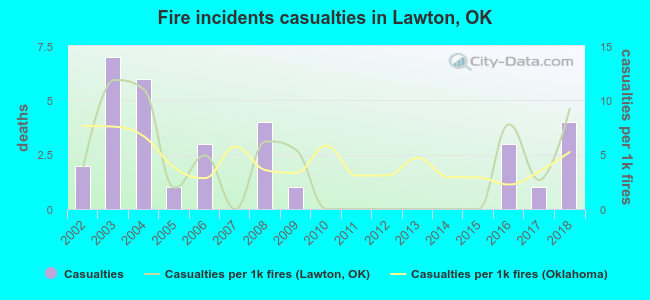 According to the data from the years 2002 - 2018 the average number of fire-related casualties per year is 2. The highest number of injuries - 7 took place in 2003, and the lowest - 0 in 2007. The data has a rising trend.
The average number of casualties per 1,000 fires is 4. This indicator was the highest - 12 in 2003, and the lowest 0 in 2007. The trend for casualties per 1,000 incidents is growing. Compared to the state value the number of casualties per 1,000 fires is higher.
According to the data from the years 2002 - 2018 the average number of fire-related casualties per year is 2. The highest number of injuries - 7 took place in 2003, and the lowest - 0 in 2007. The data has a rising trend.
The average number of casualties per 1,000 fires is 4. This indicator was the highest - 12 in 2003, and the lowest 0 in 2007. The trend for casualties per 1,000 incidents is growing. Compared to the state value the number of casualties per 1,000 fires is higher.
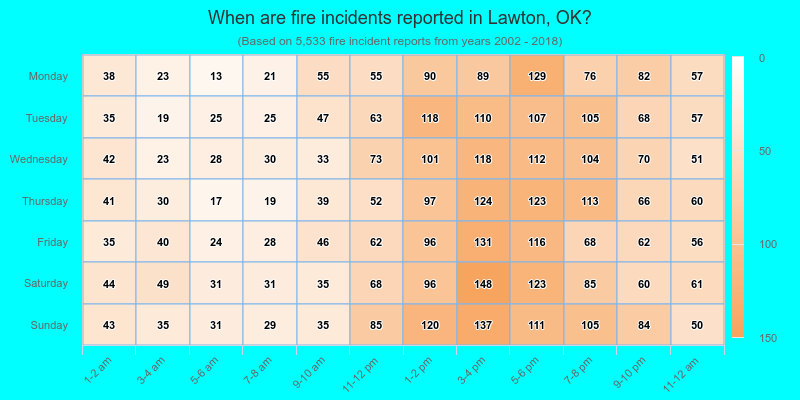
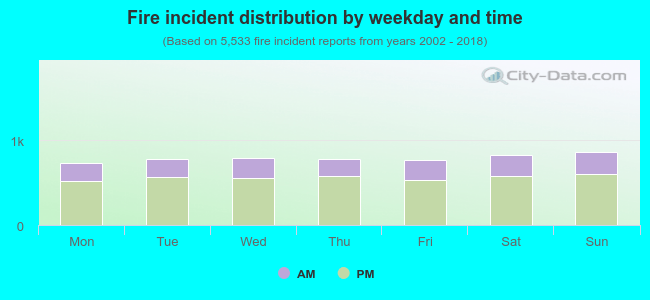 28.9% incidents where reported in the morning and 71.1% in the evening. The most fires (15.6%) took place on Sunday, and the least (13.2%) on Monday.
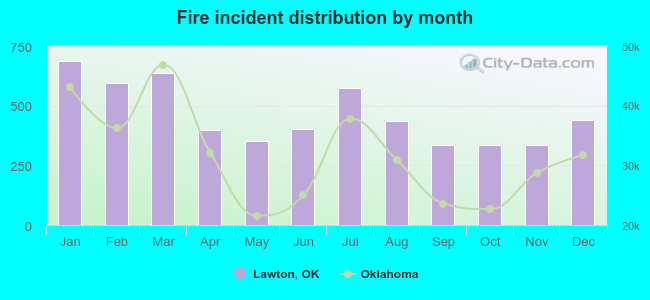 According to the 5,533 incident reports from years 2002 - 2018 most fires (12.4%) took place during January, and the least (6.1%) in September.
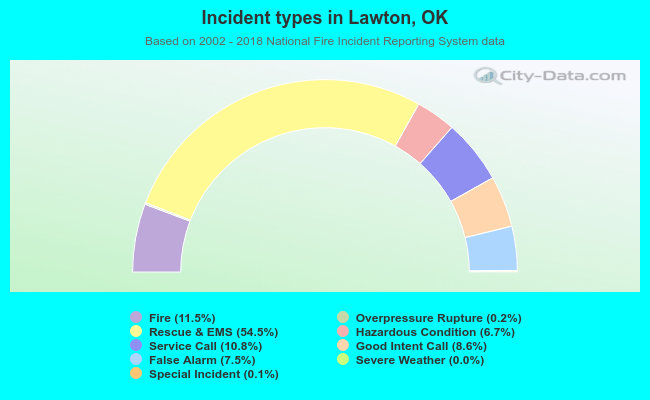 Out of all 48,143 cases reported during the years 2002 - 2018, the most belonged to the categories: Rescue & EMS (54.5%), Fire (11.5%), and Service Call (10.8%).
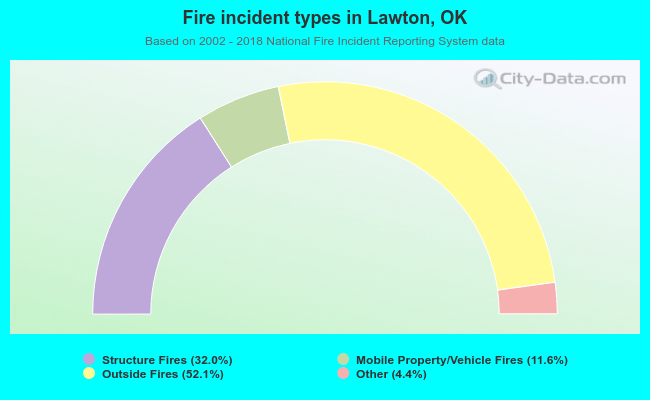 When looking into fire subcategories, the most reports belonged to: Outside Fires (52.1%), and Structure Fires (32.0%).