Chickasha: Fire Incidents, Oklahoma (OK)
Where are fire incidents reported in Chickasha, OK
Something went wrong! Please refresh the page.
| Fire incidents reported | |
|---|---|
| Sreet name | Count |
| 4TH ST | 112 |
| 16TH ST | 86 |
| 9TH ST | 62 |
| GRAND AVE | 58 |
| 12TH ST | 42 |
| IOWA | 38 |
| 17TH ST | 34 |
| 29TH ST | 34 |
| MINNESOTA | 34 |
| STATE HIGHWAY 92 | 34 |
| COUNTY ROAD 1390 | 32 |
| COUNTY STREET 2790 | 32 |
| FRISCO AVE | 32 |
| HWY 62 W | 32 |
| 7TH ST | 30 |
| 11TH ST | 28 |
| 3RD ST | 28 |
| INTERSTATE 44 | 28 |
| MICHIGAN | 28 |
| 10TH ST | 26 |
| 14TH ST | 24 |
| 1ST ST | 24 |
| 8TH ST | 24 |
| COUNTRY CLUB RD | 24 |
| HIGHWAY 62 | 24 |
| HWY 62 | 24 |
| 4 | 22 |
| COUNTY ROAD 1370 | 22 |
| COUNTY ROAD 1400 | 22 |
| I44 TPKE | 22 |
| Other | 1,667 |
2002 - 2018 National Fire Incident Reporting System (NFIRS) incidents
- Incident types reported to NFIRS in Chickasha, OK
- 15,63271.7%Rescue & EMS
- 2,72912.5%Fire
- 8603.9%Hazardous Condition
- 7413.4%False Alarm
- 7133.3%Good Intent Call
- 6823.1%Service Call
- 4071.9%Special Incident
- 460.2%Overpressure Rupture
- Fire incident types reported to NFIRS in Chickasha, OK
- 1,50155.0%Outside Fires
- 75727.7%Structure Fires
- 31811.7%Mobile Property/Vehicle Fires
- 1535.6%Other
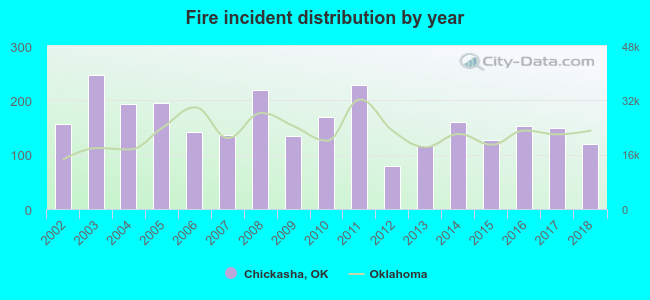 According to the data from the years 2002 - 2018 the average number of fire incidents per year is 161. The highest number of reported fire incidents - 246 took place in 2003, and the least - 80 in 2012. The data has a decreasing trend.
The average number of yearly fire incidents per 10k residents in Chickasha, OK compared to nearest cities:
(Note: Based on data for the last 3 years, including only cities with population 5,000 and above)
| Chickasha: | 86.1 |
| Anadarko: | 138.8 |
| Blanchard: | 225.7 |
| Tuttle: | 127.4 |
| Newcastle: | 57.9 |
| Mustang: | 48.0 |
| Noble: | 111.9 |
| Norman: | 24.7 |
| Purcell: | 120.4 |
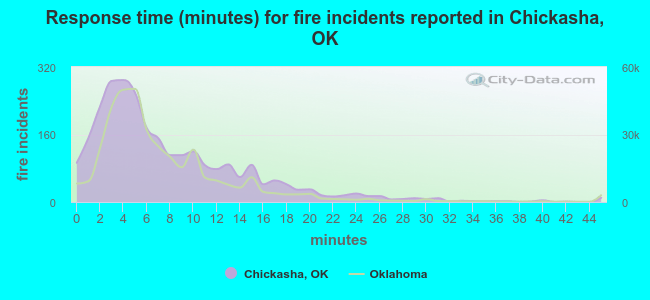 The median response time based on all reported fire incidents is 6 minutes. This is close to the state median value.
The median response time in Chickasha, OK compared to nearest cities:
(Note: Based on data for all years, including only cities with at least 500 fire incidents)
| Chickasha: | 6 minutes |
| Ninnekah: | 11 minutes |
| Anadarko: | 6 minutes |
| Rush Springs: | 13 minutes |
| Blanchard: | 10 minutes |
| Tuttle: | 7 minutes |
| Lindsay: | 7 minutes |
| Newcastle: | 6 minutes |
| Apache: | 10 minutes |
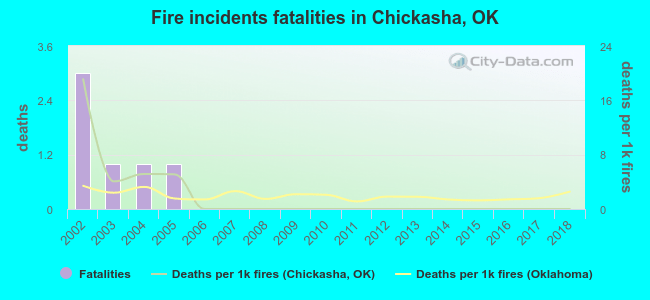 According to the data from the years 2002 - 2018 the average number of fire-related yearly deaths is 0. The highest number of reported deaths - 3 took place in 2002, and the lowest - 0 in 2006. The data has a decreasing trend.
The average number of deaths per 1,000 fire incidents is 2. This indicator was the highest - 19 in 2002, and the lowest 0 in 2006. The trend for fatalities per 1,000 fires is dropping. Compared to the Oklahoma value the number of fatalities per 1,000 fire incidents is about the same.
According to the data from the years 2002 - 2018 the average number of fire-related yearly deaths is 0. The highest number of reported deaths - 3 took place in 2002, and the lowest - 0 in 2006. The data has a decreasing trend.
The average number of deaths per 1,000 fire incidents is 2. This indicator was the highest - 19 in 2002, and the lowest 0 in 2006. The trend for fatalities per 1,000 fires is dropping. Compared to the Oklahoma value the number of fatalities per 1,000 fire incidents is about the same.Deaths per 1,000 incidents in Chickasha, OK compared to nearest cities:
(Note: Based on data for all years, including only cities with at least 2,500 fire incidents)
| Chickasha: | 2.2 |
| Norman: | 3.8 |
| Moore: | 1.1 |
| Duncan: | 1.8 |
| Oklahoma City: | 3.1 |
| Lawton: | 0.9 |
| Midwest City: | 4.7 |
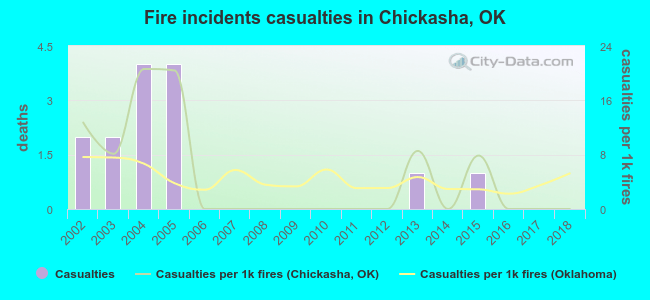 According to the reports from the years 2002 - 2018 the average number of fire-related yearly casualties is 1. The highest number of injuries - 4 took place in 2004, and the lowest - 0 in 2006. The data has a decreasing trend.
The average number of casualties per 1,000 fires is 5. This indicator was the highest - 21 in 2004, and the lowest 0 in 2006. The trend for injuries per 1,000 incidents is dropping. Compared to the Oklahoma value the number of casualties per 1,000 fire incidents is higher.
According to the reports from the years 2002 - 2018 the average number of fire-related yearly casualties is 1. The highest number of injuries - 4 took place in 2004, and the lowest - 0 in 2006. The data has a decreasing trend.
The average number of casualties per 1,000 fires is 5. This indicator was the highest - 21 in 2004, and the lowest 0 in 2006. The trend for injuries per 1,000 incidents is dropping. Compared to the Oklahoma value the number of casualties per 1,000 fire incidents is higher.
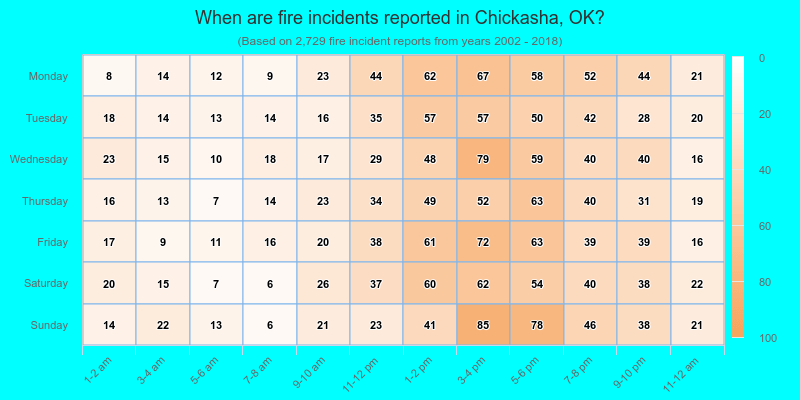
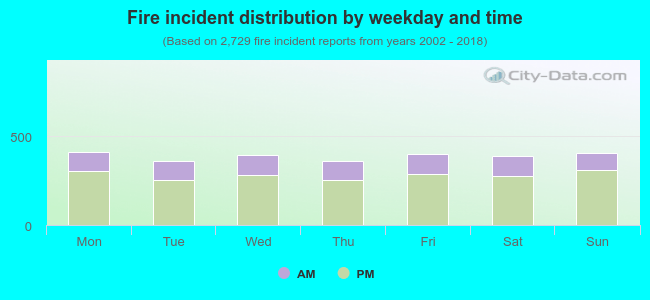 27.8% incidents where reported in the morning and 72.2% in the evening. The most fires (15.2%) took place on Monday, and the least (13.2%) on Thursday.
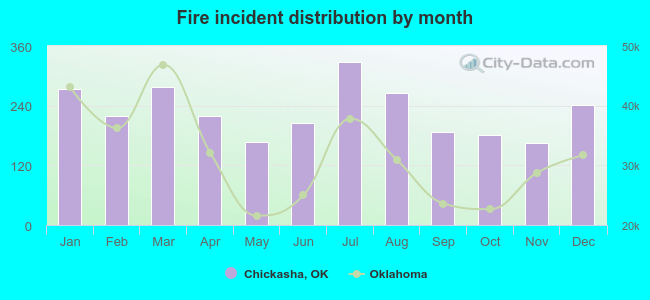 Based on the 2,729 reports from years 2002 - 2018 most fires (12.0%) took place during July, and the least (6.0%) in November.
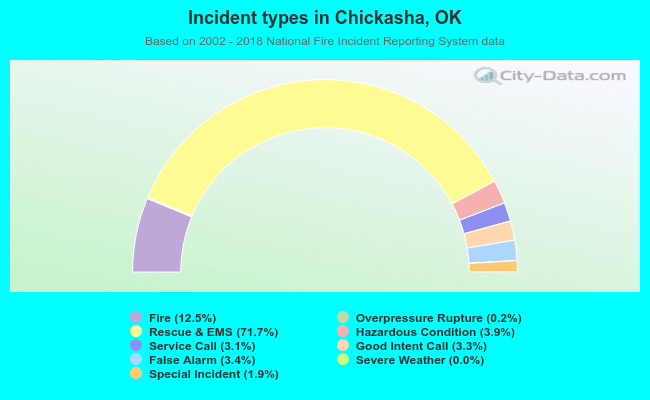 Out of all 21,813 cases reported during the years 2002 - 2018, the most belonged to the categories: Rescue & EMS (71.7%), Fire (12.5%), and Hazardous Condition (3.9%).
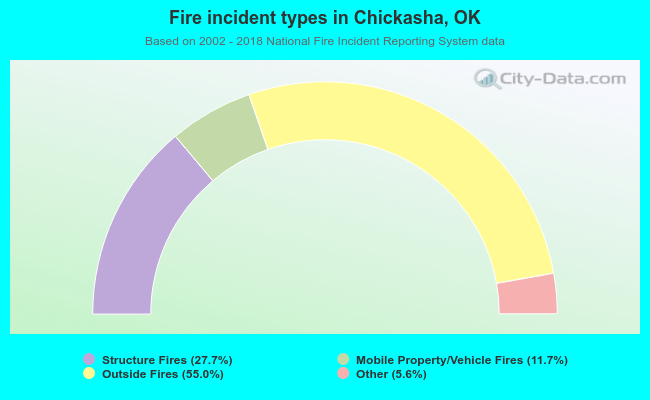 When looking into fire subcategories, the most reports belonged to: Outside Fires (55.0%), and Structure Fires (27.7%).