Lee's Summit: Fire Incidents, Missouri (MO)
Where are fire incidents reported in Lee's Summit, MO
Something went wrong! Please refresh the page.
| Fire incidents reported | |
|---|---|
| Sreet name | Count |
| CHIPMAN RD | 134 |
| DOUGLAS ST | 106 |
| 3RD ST | 100 |
| BLUE PKWY | 74 |
| COLBERN RD | 74 |
| INDEPENDENCE AVE | 74 |
| WOODS CHAPEL RD | 74 |
| M 291 HWY | 72 |
| WARD RD | 72 |
| 291 HWY | 58 |
| RICE RD | 56 |
| PRYOR RD | 52 |
| I 470 HWY | 48 |
| LANGSFORD RD | 46 |
| HAMBLEN RD | 44 |
| HOWARD AVE | 44 |
| 50 HWY | 40 |
| OLDHAM PKWY | 40 |
| US 50 HWY | 38 |
| TOWN CENTRE BLVD | 34 |
| MAIN ST | 32 |
| MURRAY RD | 32 |
| 2ND ST | 30 |
| 6TH ST | 30 |
| RIDGEVIEW DR | 30 |
| 5TH ST | 28 |
| DOUGLAS | 28 |
| I470 | 28 |
| TODD GEORGE PKWY | 28 |
| 3RD TER | 26 |
| Other | 938 |
2002 - 2011 National Fire Incident Reporting System (NFIRS) incidents
- Incident types reported to NFIRS in Lee`s Summit, MO
- 6,15644.1%Rescue & EMS
- 2,51018.0%Fire
- 2,46617.7%Hazardous Condition
- 1,46410.5%False Alarm
- 9166.6%Service Call
- 4042.9%Good Intent Call
- 340.2%Severe Weather
- Fire incident types reported to NFIRS in Lee`s Summit, MO
- 1,19847.7%Outside Fires
- 72328.8%Structure Fires
- 42216.8%Mobile Property/Vehicle Fires
- 1676.7%Other
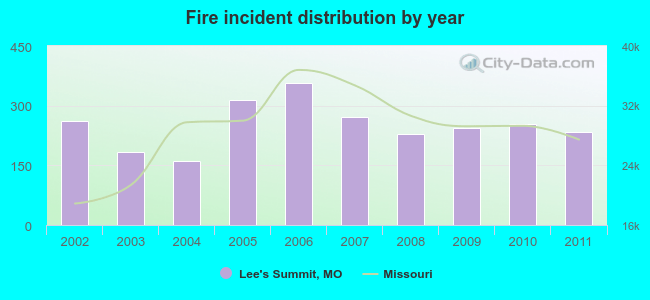 According to the data from the years 2002 - 2011 the average number of fires per year is 251. The highest number of fire incidents - 358 took place in 2006, and the least - 161 in 2004. The data has a decreasing trend.
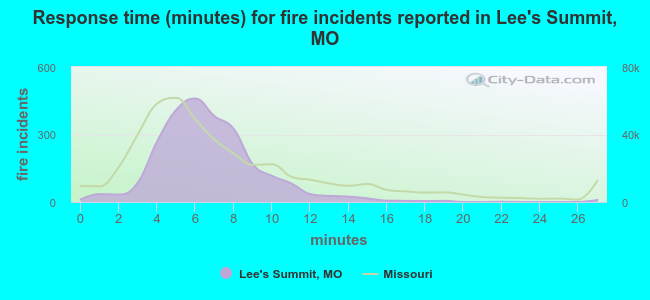 The median response time based on all reported fire incidents is 6 minutes. This is close to the state median value.
The median response time in Lee`s Summit, MO compared to nearest cities:
(Note: Based on data for all years, including only cities with at least 500 fire incidents)
| Lee's Summit: | 6 minutes |
| Raytown: | 5 minutes |
| Grandview: | 5 minutes |
| Blue Springs: | 5 minutes |
| Raymore: | 6 minutes |
| Grain Valley: | 6 minutes |
| Pleasant Hill: | 8 minutes |
| Independence: | 5 minutes |
| Belton: | 6 minutes |
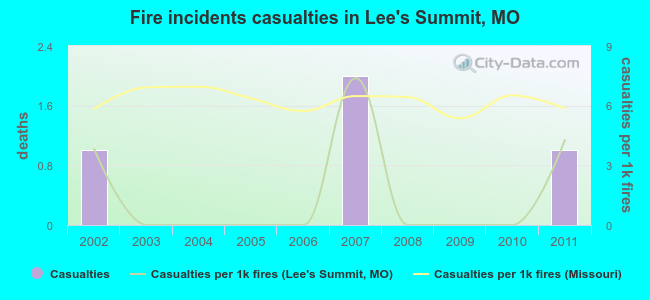 Based on the reports from the years 2002 - 2011 the average number of fire-related casualties per year is 0. The highest number of casualties - 2 took place in 2007, and the lowest - 0 in 2003. The data has a constant trend.
The average number of casualties per 1,000 fires is 2. This indicator was the highest - 7 in 2007, and the lowest 0 in 2003. The trend for casualties per 1,000 fire incidents is growing. Compared to the state value the number of casualties per 1,000 fire incidents is much lower.
Based on the reports from the years 2002 - 2011 the average number of fire-related casualties per year is 0. The highest number of casualties - 2 took place in 2007, and the lowest - 0 in 2003. The data has a constant trend.
The average number of casualties per 1,000 fires is 2. This indicator was the highest - 7 in 2007, and the lowest 0 in 2003. The trend for casualties per 1,000 fire incidents is growing. Compared to the state value the number of casualties per 1,000 fire incidents is much lower.Casualties per 1,000 incidents in Lee`s Summit, MO compared to nearest cities:
(Note: Based on data for all years, including only cities with at least 500 fire incidents)
| Lee's Summit: | 1.6 |
| Raytown: | 1.5 |
| Grandview: | 40.2 |
| Blue Springs: | 13.8 |
| Raymore: | 6.8 |
| Grain Valley: | 4.9 |
| Pleasant Hill: | 13.8 |
| Independence: | 16.0 |
| Belton: | 14.5 |
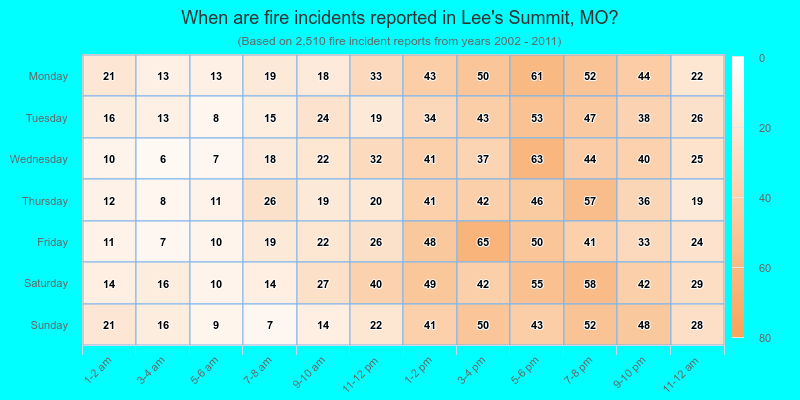
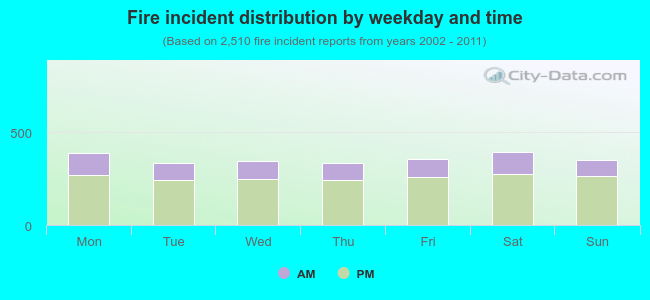 28.2% incidents where reported in the morning and 71.8% in the evening. The most fires (15.8%) took place on Saturday, and the least (13.4%) on Tuesday.
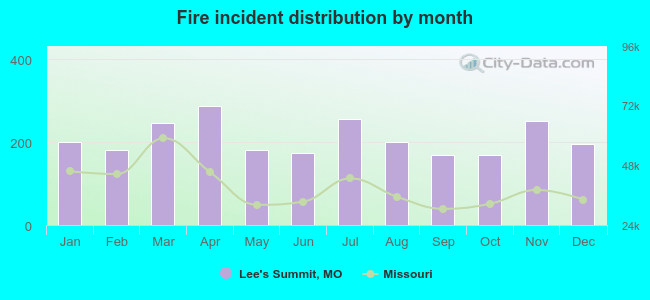 According to the 2,510 fire incidents from years 2002 - 2011 most fires (11.5%) took place during April, and the least (6.7%) in October.
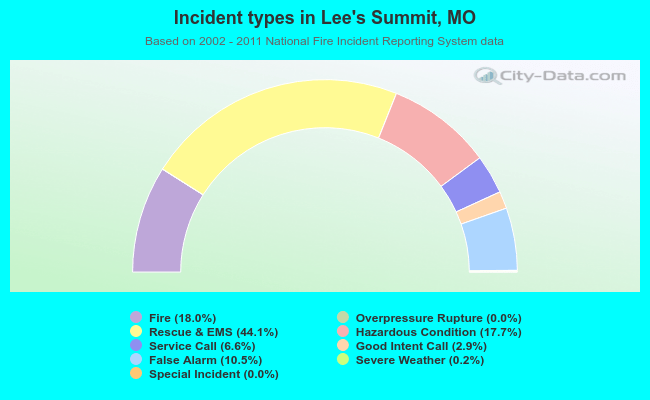 Out of all 13,956 cases reported during the years 2002 - 2011, the most belonged to the categories: Rescue & EMS (44.1%), Fire (18.0%), and Hazardous Condition (17.7%).
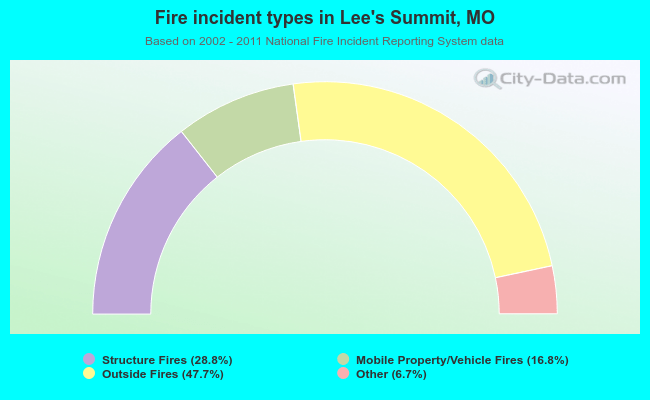 When looking into fire subcategories, the most incidents belonged to: Outside Fires (47.7%), and Structure Fires (28.8%).