Belton: Fire Incidents, Missouri (MO)
Where are fire incidents reported in Belton, MO
Something went wrong! Please refresh the page.
| Fire incidents reported | |
|---|---|
| Sreet name | Count |
| NORTH AVE | 166 |
| SCOTT AVE | 166 |
| 71 HWY | 100 |
| PROSPECT AVE | 92 |
| MULLEN RD | 84 |
| 171ST ST | 70 |
| Y HWY | 68 |
| MAIN ST | 56 |
| 187TH ST | 48 |
| CEDAR | 44 |
| 58 HWY | 42 |
| SPRING VALLEY RD | 40 |
| CAMBRIDGE RD | 36 |
| LAKEWOOD TER | 36 |
| SCOTT | 36 |
| 195TH ST | 34 |
| CROWN PARK | 34 |
| HOLMES RD | 34 |
| 155TH ST | 32 |
| 165TH ST | 32 |
| 163RD ST | 30 |
| COMMERCIAL ST | 30 |
| CLEVELAND AVE | 28 |
| HARGIS LANE | 28 |
| MONTE VERDE DR | 28 |
| COUNTY LINE RD | 26 |
| PECULIAR DR | 24 |
| SECOND ST | 24 |
| 215TH ST | 22 |
| TERRY ST | 22 |
| Other | 487 |
2002 - 2018 National Fire Incident Reporting System (NFIRS) incidents
- Incident types reported to NFIRS in Belton, MO
- 14,83965.9%Rescue & EMS
- 1,9998.9%Fire
- 1,9568.7%Hazardous Condition
- 1,6477.3%Service Call
- 1,2855.7%Good Intent Call
- 7373.3%False Alarm
- Fire incident types reported to NFIRS in Belton, MO
- 86043.0%Structure Fires
- 78139.1%Outside Fires
- 30115.1%Mobile Property/Vehicle Fires
- 572.9%Other
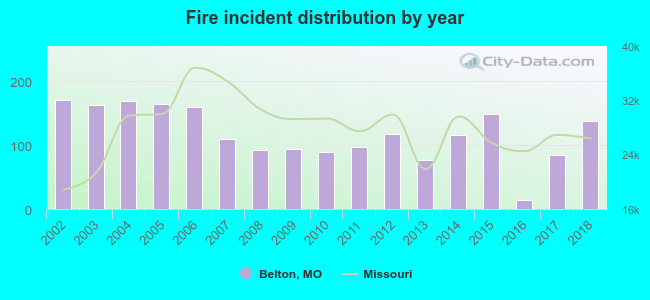 Based on the data from the years 2002 - 2018 the average number of fire incidents per year is 118. The highest number of fire incidents - 170 took place in 2002, and the least - 14 in 2016. The data has a decreasing trend.
The average number of yearly fire incidents per 10k residents in Belton, MO compared to nearest cities:
(Note: Based on data for the last 3 years, including only cities with population 5,000 and above)
| Belton: | 34.0 |
| Raymore: | 10.5 |
| Grandview: | 44.0 |
| Greenwood: | 23.1 |
| Raytown: | 6.4 |
| Pleasant Hill: | 32.7 |
| Harrisonville: | 7.0 |
| Kansas City: | 38.0 |
| Independence: | 40.0 |
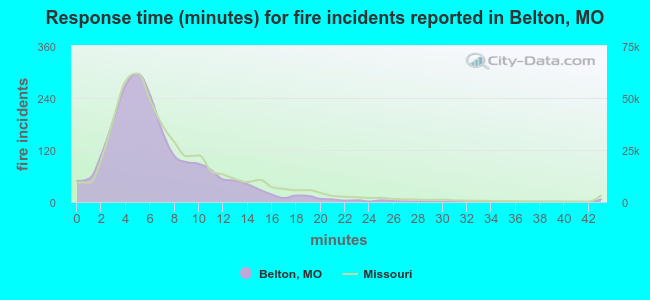 The median response time based on all reported fire incidents is 6 minutes. This is similar to the state median value.
The median response time in Belton, MO compared to nearest cities:
(Note: Based on data for all years, including only cities with at least 500 fire incidents)
| Belton: | 6 minutes |
| Raymore: | 6 minutes |
| Grandview: | 5 minutes |
| Peculiar: | 8 minutes |
| Leawood: | 5 minutes |
| Lee's Summit: | 6 minutes |
| Overland Park: | 6 minutes |
| Raytown: | 5 minutes |
| Pleasant Hill: | 8 minutes |
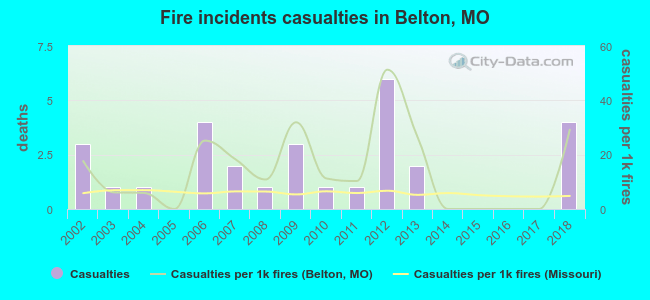 Based on the data from the years 2002 - 2018 the average number of fire-related yearly casualties is 2. The highest number of reported casualties - 6 took place in 2012, and the lowest - 0 in 2005. The data has a growing trend.
The average number of injuries per 1,000 fires is 14. This indicator was the highest - 51 in 2012, and the lowest 0 in 2005. The trend for casualties per 1,000 fire incidents is rising. Compared to the state value the number of injuries per 1,000 fire incidents is much higher.
Based on the data from the years 2002 - 2018 the average number of fire-related yearly casualties is 2. The highest number of reported casualties - 6 took place in 2012, and the lowest - 0 in 2005. The data has a growing trend.
The average number of injuries per 1,000 fires is 14. This indicator was the highest - 51 in 2012, and the lowest 0 in 2005. The trend for casualties per 1,000 fire incidents is rising. Compared to the state value the number of injuries per 1,000 fire incidents is much higher.Casualties per 1,000 incidents in Belton, MO compared to nearest cities:
(Note: Based on data for all years, including only cities with at least 500 fire incidents)
| Belton: | 14.5 |
| Raymore: | 6.8 |
| Grandview: | 40.2 |
| Peculiar: | 8.4 |
| Leawood: | 8.3 |
| Lee's Summit: | 1.6 |
| Overland Park: | 25.7 |
| Raytown: | 1.5 |
| Pleasant Hill: | 13.8 |
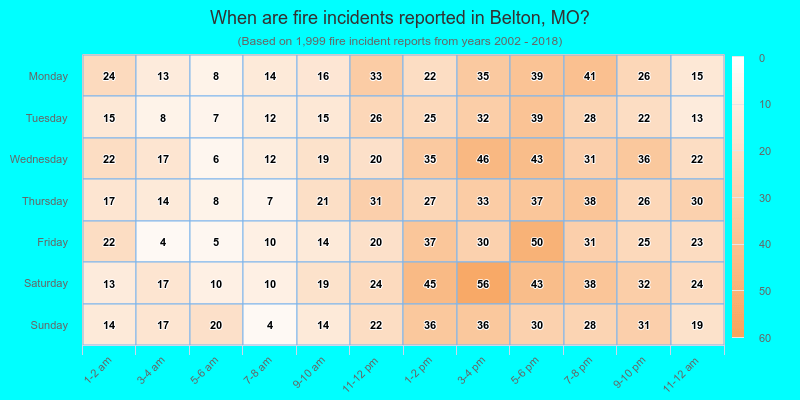
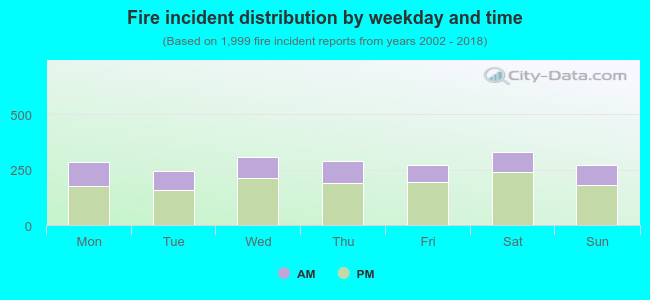 32.2% incidents where reported in the morning and 67.8% in the evening. The most fires (16.6%) took place on Saturday, and the least (12.1%) on Tuesday.
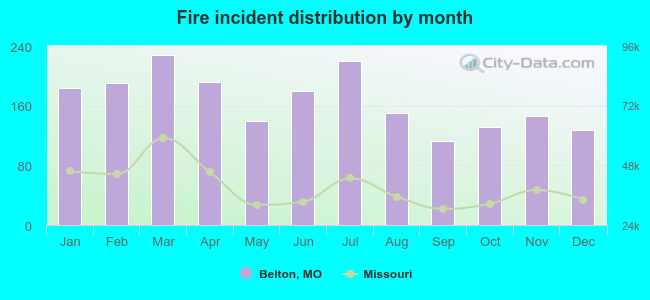 According to the 1,999 fire incidents from years 2002 - 2018 most fires (11.4%) took place during March, and the least (5.6%) in September.
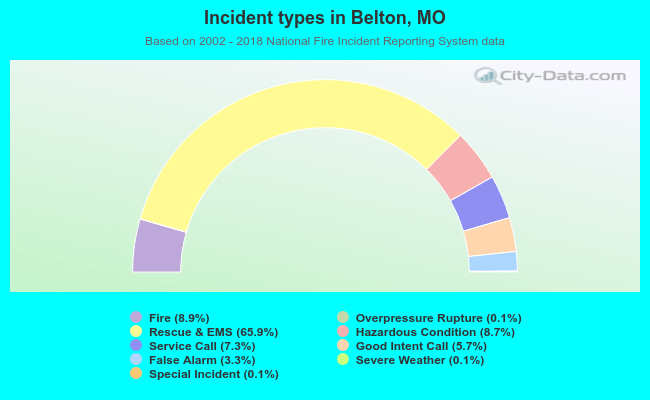 Out of all 22,501 cases reported during the years 2002 - 2018, the most belonged to the categories: Rescue & EMS (65.9%), Fire (8.9%), and Hazardous Condition (8.7%).
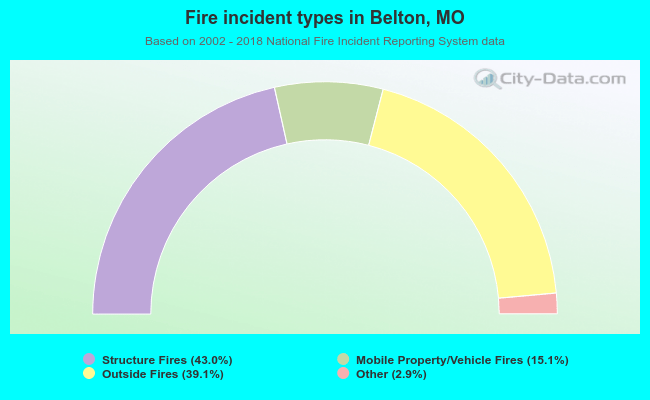 When looking into fire subcategories, the most incidents belonged to: Structure Fires (43.0%), and Outside Fires (39.1%).