Leeds: Fire Incidents, Alabama (AL)
Where are fire incidents reported in Leeds, AL
Something went wrong! Please refresh the page.
| Fire incidents reported | |
|---|---|
| Sreet name | Count |
| PARKWAY DR | 98 |
| PARKWAY DR | 89 |
| CLAYTON DR | 75 |
| INTERSTATE 20 | 66 |
| MONTEVALLO RD | 65 |
| ASHVILLE RD | 55 |
| MONTEVALLO RD | 46 |
| INTERSTATE 20 WEST BOUND | 45 |
| ROBERT E LEE ST | 45 |
| ASHVILLE RD | 39 |
| BARK AVE | 35 |
| DOUGLAS AVE | 30 |
| HIGHWAY 78 | 30 |
| INTERSTATE 20 EAST BOUND | 30 |
| OAK TRAIL WAY | 30 |
| CAHABA AVE | 25 |
| HERITAGE RD | 25 |
| WHITFIELD AVE | 25 |
| ASHVILLE RD | 20 |
| DUNNAVANT RD | 20 |
| FLOYD BRADFORD RD | 20 |
| FRISCO AVE | 20 |
| GRAND RIVER BLVD | 20 |
| HARDING ST | 20 |
| LANE DR | 20 |
| MONTEVALLO ROAD | 20 |
| REX LAKE RD | 20 |
| ROSS ST | 20 |
| SHALE RD | 20 |
| THOMAS AVE | 20 |
2003 - 2018 National Fire Incident Reporting System (NFIRS) incidents
- Incident types reported to NFIRS in Leeds, AL
- 5,67667.5%Rescue & EMS
- 86810.3%Fire
- 8189.7%Service Call
- 4074.8%False Alarm
- 3173.8%Hazardous Condition
- 2833.4%Good Intent Call
- 210.2%Severe Weather
- 120.1%Special Incident
- Fire incident types reported to NFIRS in Leeds, AL
- 40646.8%Outside Fires
- 24728.5%Structure Fires
- 12614.5%Mobile Property/Vehicle Fires
- 8910.3%Other
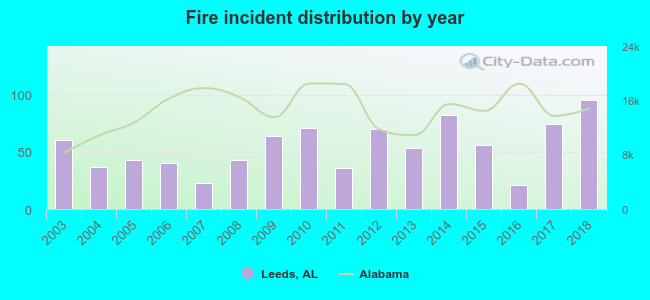 Based on the data from the years 2003 - 2018 the average number of fires per year is 54. The highest number of fire incidents - 95 took place in 2018, and the least - 21 in 2016. The data has a growing trend.
The average number of yearly fire incidents per 10k residents in Leeds, AL compared to nearest cities:
(Note: Based on data for the last 3 years, including only cities with population 5,000 and above)
| Leeds: | 53.0 |
| Moody: | 36.9 |
| Trussville: | 18.4 |
| Irondale: | 55.7 |
| Center Point: | 49.5 |
| Mountain Brook: | 11.4 |
| Clay: | 5.2 |
| Pinson: | 104.1 |
| Tarrant: | 58.6 |
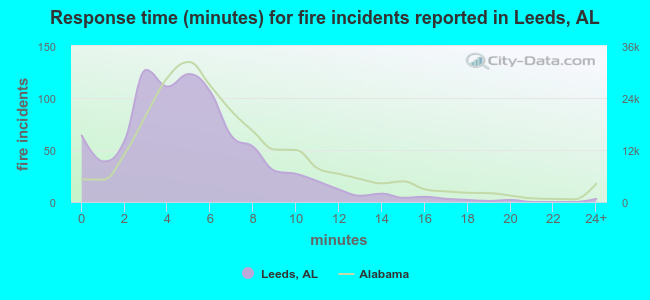 The median response time based on all reported fire incidents is 5 minutes. This is lower compared to the Alabama median value.
The median response time in Leeds, AL compared to nearest cities:
(Note: Based on data for all years, including only cities with at least 500 fire incidents)
| Leeds: | 5 minutes |
| Trussville: | 7 minutes |
| Irondale: | 5 minutes |
| Pinson: | 6 minutes |
| Tarrant: | 3 minutes |
| Birmingham: | 6 minutes |
| Vestavia Hills: | 4 minutes |
| Homewood: | 6 minutes |
| Hoover: | 5 minutes |
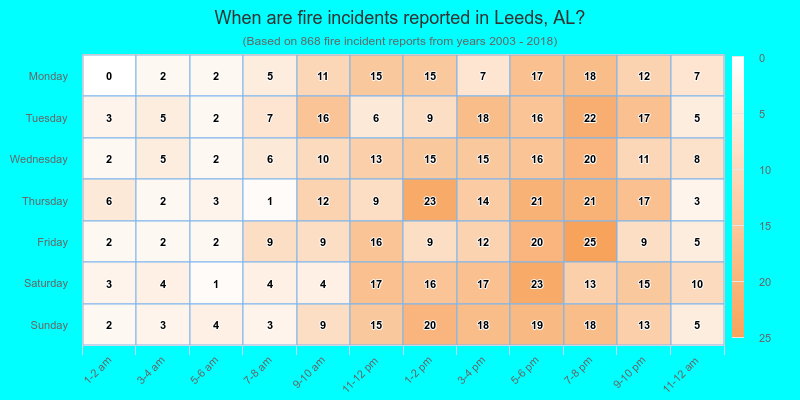
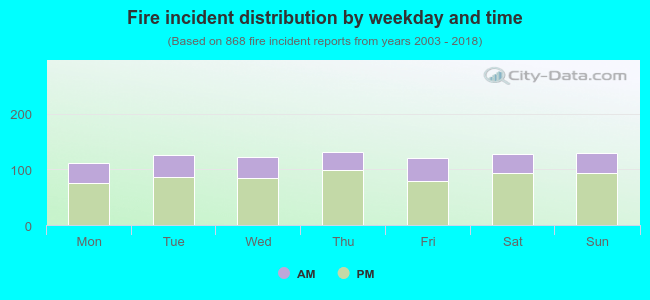 29.3% incidents where reported in the morning and 70.7% in the evening. The most fires (15.2%) took place on Thursday, and the least (12.8%) on Monday.
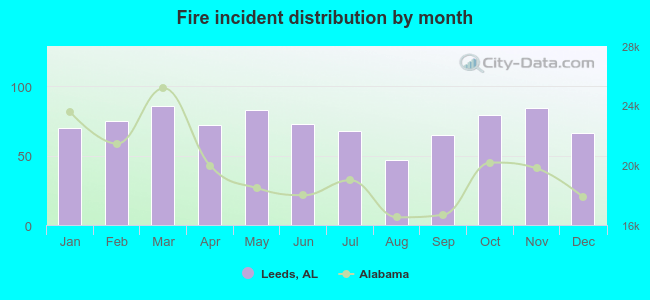 According to the 868 fire incidents from years 2003 - 2018 most fires (9.9%) took place during March, and the least (5.4%) in August.
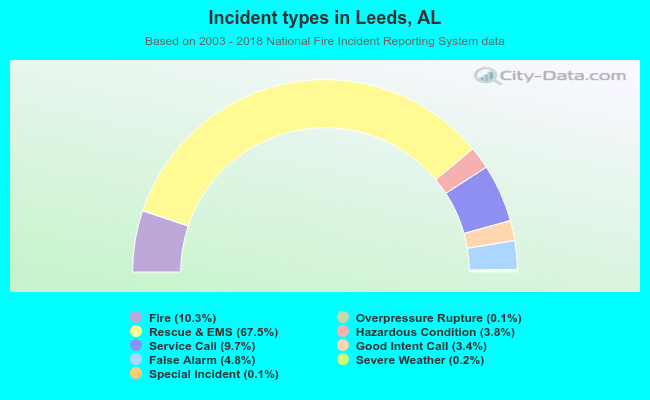 Out of all 8,408 cases reported during the years 2003 - 2018, the most belonged to the categories: Rescue & EMS (67.5%), Fire (10.3%), and Service Call (9.7%).
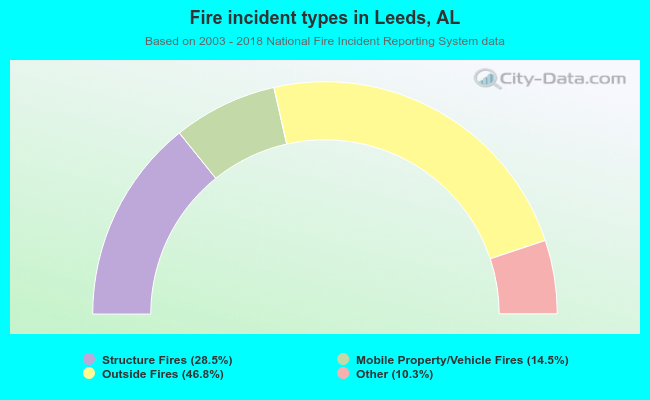 When looking into fire subcategories, the most reports belonged to: Outside Fires (46.8%), and Structure Fires (28.5%).