Little Rock: Fire Incidents, Arkansas (AR)
Where are fire incidents reported in Little Rock, AR
Something went wrong! Please refresh the page.
| Fire incidents reported | |
|---|---|
| Sreet name | Count |
| INTERSTATE 30 | 948 |
| BASELINE RD | 766 |
| CANTRELL RD | 648 |
| MARKHAM ST | 546 |
| UNIVERSITY AVE | 542 |
| COLONEL GLENN RD | 458 |
| GEYER SPRINGS RD | 444 |
| 12TH ST | 364 |
| 65TH ST | 354 |
| CHICOT RD | 352 |
| SHACKLEFORD RD | 328 |
| ROOSEVELT RD | 318 |
| ASHER AVE | 312 |
| INTERSTATE 430 | 308 |
| STAGECOACH RD | 278 |
| INTERSTATE 630 | 270 |
| RODNEY PARHAM RD | 264 |
| CHENAL PKWY | 260 |
| MABELVALE PIKE | 260 |
| KANIS RD | 250 |
| 36TH ST | 238 |
| 7TH ST | 234 |
| BROADWAY ST | 234 |
| RESERVOIR RD | 228 |
| ARCH STREET | 222 |
| ELM ST | 216 |
| 13TH ST | 204 |
| 17TH ST | 204 |
| 9TH ST | 200 |
| 11TH ST | 198 |
| Other | 12,952 |
2003 - 2018 National Fire Incident Reporting System (NFIRS) incidents
- Incident types reported to NFIRS in Little Rock, AR
- 80,52149.9%Rescue & EMS
- 23,40014.5%Fire
- 17,42610.8%Hazardous Condition
- 16,41110.2%Good Intent Call
- 14,4368.9%False Alarm
- 8,2485.1%Service Call
- 4290.3%Special Incident
- 4170.3%Overpressure Rupture
- 2370.1%Severe Weather
- Fire incident types reported to NFIRS in Little Rock, AR
- 9,06438.7%Structure Fires
- 8,84537.8%Outside Fires
- 3,74116.0%Mobile Property/Vehicle Fires
- 1,7507.5%Other
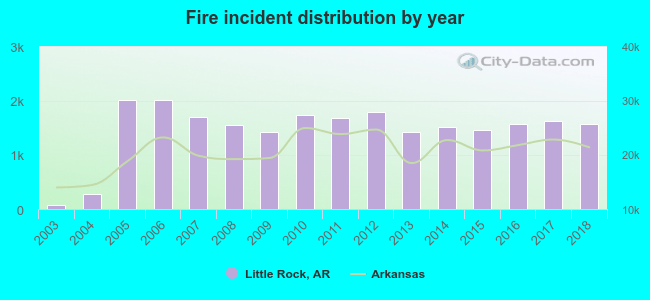 According to the data from the years 2003 - 2018 the average number of fires per year is 1,461. The highest number of reported fires - 2,005 took place in 2005, and the least - 78 in 2003. The data has a rising trend.
The average number of yearly fire incidents per 10k residents in Little Rock, AR compared to nearest cities:
(Note: Based on data for the last 3 years, including only cities with population 5,000 and above)
| Little Rock: | 80.1 |
| North Little Rock: | 87.9 |
| Maumelle: | 23.6 |
| Sherwood: | 68.3 |
| Bryant: | 54.2 |
| East End: | 1.4 |
| Jacksonville: | 71.7 |
| Benton: | 96.6 |
| Cabot: | 64.8 |
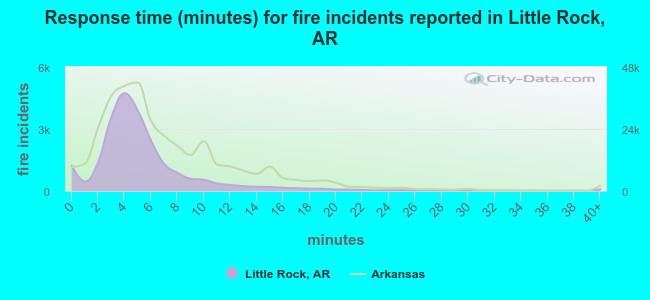 The median response time based on all reported fire incidents is 5 minutes. This is lower compared to the state median value.
The median response time in Little Rock, AR compared to nearest cities:
(Note: Based on data for all years, including only cities with at least 500 fire incidents)
| Little Rock: | 5 minutes |
| North Little Rock: | 5 minutes |
| Maumelle: | 3 minutes |
| Sherwood: | 4 minutes |
| Alexander: | 9 minutes |
| Bryant: | 5 minutes |
| Scott: | 9 minutes |
| Jacksonville: | 5 minutes |
| Bauxite: | 10 minutes |
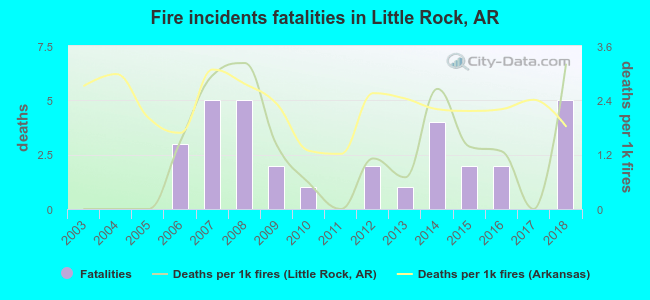 According to the reports from the years 2003 - 2018 the average number of fire-related fatalities per year is 2. The highest number of reported deaths - 5 took place in 2007, and the lowest - 0 in 2003. The data has an increasing trend.
The average number of fatalities per 1,000 fire incidents is 1. This indicator was the highest - 3 in 2008, and the lowest 0 in 2003. The trend for fatalities per 1,000 incidents is rising. Compared to the state value the number of deaths per 1,000 fires is lower.
According to the reports from the years 2003 - 2018 the average number of fire-related fatalities per year is 2. The highest number of reported deaths - 5 took place in 2007, and the lowest - 0 in 2003. The data has an increasing trend.
The average number of fatalities per 1,000 fire incidents is 1. This indicator was the highest - 3 in 2008, and the lowest 0 in 2003. The trend for fatalities per 1,000 incidents is rising. Compared to the state value the number of deaths per 1,000 fires is lower.Deaths per 1,000 incidents in Little Rock, AR compared to nearest cities:
(Note: Based on data for all years, including only cities with at least 2,500 fire incidents)
| Little Rock: | 1.4 |
| North Little Rock: | 2.3 |
| Sherwood: | 0.7 |
| Jacksonville: | 1.6 |
| Benton: | 1.2 |
| Cabot: | 1.1 |
| Conway: | 2.7 |
| Malvern: | 5.0 |
| Pine Bluff: | 1.5 |
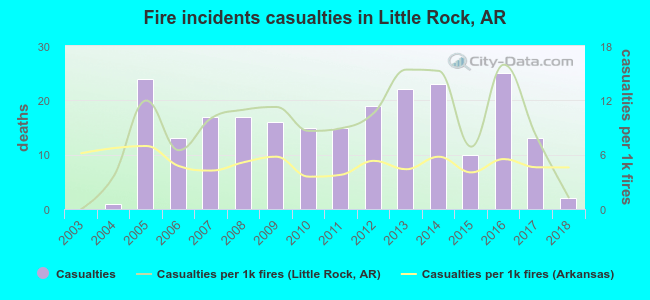 Based on the reports from the years 2003 - 2018 the average number of fire-related casualties per year is 15. The highest number of injuries - 25 took place in 2016, and the lowest - 0 in 2003. The data has a growing trend.
The average number of injuries per 1,000 fires is 9. This indicator was the highest - 16 in 2016, and the lowest 0 in 2003. The trend for casualties per 1,000 fire incidents is increasing. Compared to the Arkansas value the number of casualties per 1,000 fires is higher.
Based on the reports from the years 2003 - 2018 the average number of fire-related casualties per year is 15. The highest number of injuries - 25 took place in 2016, and the lowest - 0 in 2003. The data has a growing trend.
The average number of injuries per 1,000 fires is 9. This indicator was the highest - 16 in 2016, and the lowest 0 in 2003. The trend for casualties per 1,000 fire incidents is increasing. Compared to the Arkansas value the number of casualties per 1,000 fires is higher.Casualties per 1,000 incidents in Little Rock, AR compared to nearest cities:
(Note: Based on data for all years, including only cities with at least 500 fire incidents)
| Little Rock: | 9.9 |
| North Little Rock: | 4.5 |
| Maumelle: | 10.5 |
| Sherwood: | 1.5 |
| Alexander: | 3.5 |
| Bryant: | 3.5 |
| Scott: | 0.0 |
| Jacksonville: | 8.1 |
| Bauxite: | 0.0 |
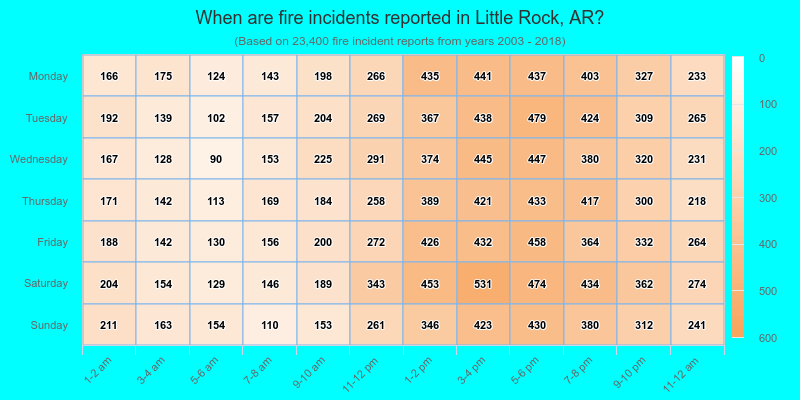
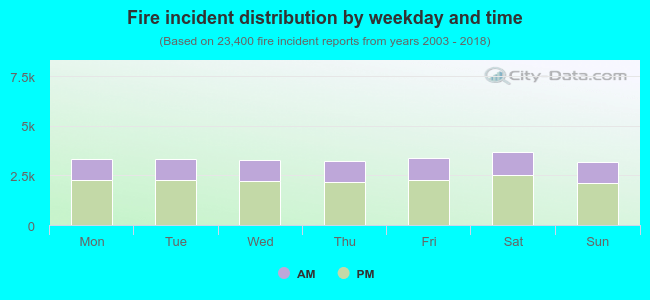 32.2% incidents where reported in the morning and 67.8% in the evening. The most fires (15.8%) took place on Saturday, and the least (13.6%) on Sunday.
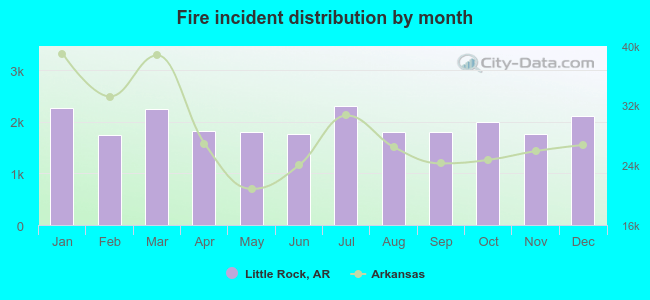 According to the 23,400 fire incidents from years 2003 - 2018 most fires (9.9%) took place during July, and the least (7.5%) in February.
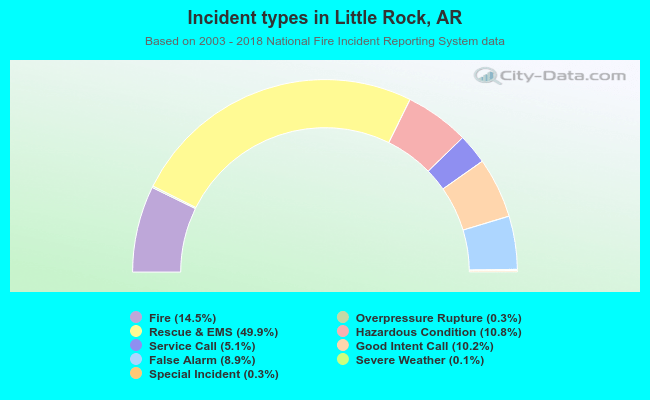 Out of all 161,525 cases reported during the years 2003 - 2018, the most belonged to the categories: Rescue & EMS (49.9%), Fire (14.5%), and Hazardous Condition (10.8%).
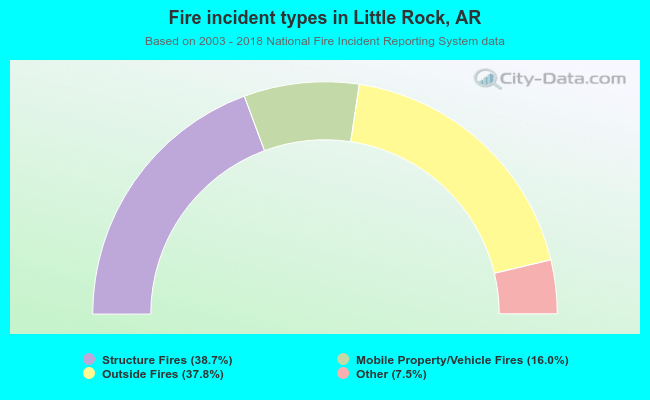 When looking into fire subcategories, the most incidents belonged to: Structure Fires (38.7%), and Outside Fires (37.8%).