Malvern: Fire Incidents, Arkansas (AR)
Where are fire incidents reported in Malvern, AR
Something went wrong! Please refresh the page.
| Fire incidents reported | |
|---|---|
| Sreet name | Count |
| HWY 67 HWY | 122 |
| PAGE AVE | 92 |
| SULLENBERGER | 76 |
| I30 HWY | 72 |
| INTERSTATE 30 | 64 |
| I30 | 62 |
| HWY 270 | 60 |
| HWY 270 HWY | 60 |
| HIGHWAY 84 | 58 |
| I-30 HWY | 50 |
| MILITARY RD | 50 |
| 9 HWY | 46 |
| RIDGE RD | 46 |
| DYER ST | 44 |
| HWY 51 HWY | 44 |
| HWY 67 | 44 |
| MAIN | 44 |
| HWY 9 | 40 |
| 67 HWY | 38 |
| BABCOCK ST | 38 |
| MILL | 38 |
| OLD DIXONVILLE RD | 38 |
| CABE ST | 36 |
| WINEDOT RD | 32 |
| NEW DIXONVILLE RD | 30 |
| PINE BLUFF | 30 |
| MILITARY RD. | 28 |
| REYNOLDS RD | 28 |
| STRINGTOWN RD | 28 |
| SULPHUR SPRINGS RD | 28 |
| Other | 1,506 |
2002 - 2018 National Fire Incident Reporting System (NFIRS) incidents
- Incident types reported to NFIRS in Malvern, AR
- 2,97237.5%Fire
- 2,30029.0%Rescue & EMS
- 7799.8%Service Call
- 7759.8%Hazardous Condition
- 6007.6%False Alarm
- 4655.9%Good Intent Call
- 210.3%Severe Weather
- 140.2%Special Incident
- Fire incident types reported to NFIRS in Malvern, AR
- 1,44048.5%Outside Fires
- 97532.8%Structure Fires
- 43614.7%Mobile Property/Vehicle Fires
- 1214.1%Other
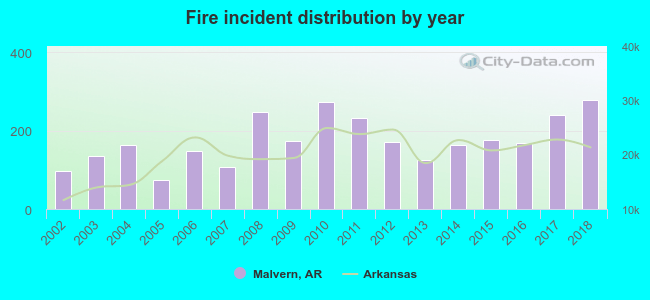 According to the data from the years 2002 - 2018 the average number of fire incidents per year is 175. The highest number of reported fires - 277 took place in 2018, and the least - 74 in 2005. The data has a rising trend.
The average number of yearly fire incidents per 10k residents in Malvern, AR compared to nearest cities:
(Note: Based on data for the last 3 years, including only cities with population 5,000 and above)
| Malvern: | 210.6 |
| Hot Springs: | 127.3 |
| Benton: | 96.6 |
| Arkadelphia: | 80.4 |
| Hot Springs Village: | 27.8 |
| Bryant: | 54.2 |
| East End: | 1.4 |
| Little Rock: | 80.1 |
| Maumelle: | 23.6 |
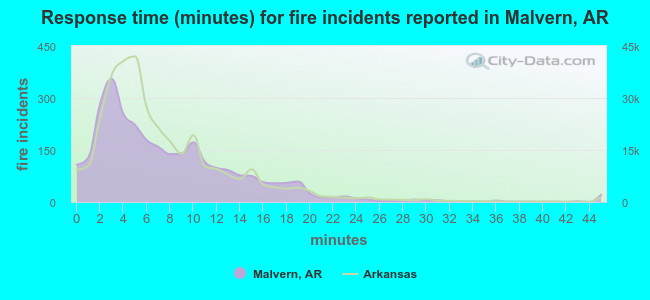 The median response time based on all reported fire incidents is 6 minutes. This is similar to the Arkansas median value.
The median response time in Malvern, AR compared to nearest cities:
(Note: Based on data for all years, including only cities with at least 500 fire incidents)
| Malvern: | 6 minutes |
| Hot Springs: | 5 minutes |
| Benton: | 6 minutes |
| Bauxite: | 10 minutes |
| Arkadelphia: | 5 minutes |
| Sheridan: | 10 minutes |
| Bryant: | 5 minutes |
| Alexander: | 9 minutes |
| Hensley: | 10 minutes |
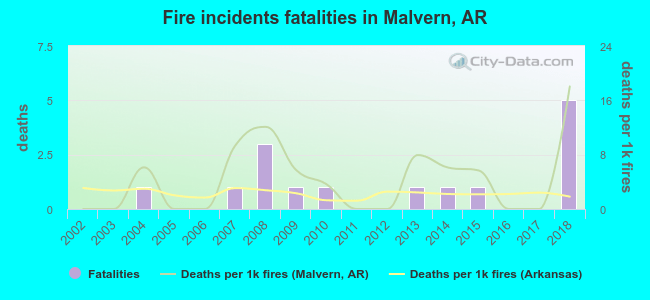 Based on the data from the years 2002 - 2018 the average number of fire-related yearly deaths is 1. The highest number of deaths - 5 took place in 2018, and the lowest - 0 in 2002. The data has an increasing trend.
The average number of fatalities per 1,000 fire incidents is 4. This indicator was the highest - 18 in 2018, and the lowest 0 in 2002. The trend for fatalities per 1,000 incidents is rising. Compared to the state value the number of deaths per 1,000 incidents is much higher.
Based on the data from the years 2002 - 2018 the average number of fire-related yearly deaths is 1. The highest number of deaths - 5 took place in 2018, and the lowest - 0 in 2002. The data has an increasing trend.
The average number of fatalities per 1,000 fire incidents is 4. This indicator was the highest - 18 in 2018, and the lowest 0 in 2002. The trend for fatalities per 1,000 incidents is rising. Compared to the state value the number of deaths per 1,000 incidents is much higher.Deaths per 1,000 incidents in Malvern, AR compared to nearest cities:
(Note: Based on data for all years, including only cities with at least 2,500 fire incidents)
| Malvern: | 5.0 |
| Hot Springs: | 4.8 |
| Benton: | 1.2 |
| Little Rock: | 1.4 |
| North Little Rock: | 2.3 |
| Pine Bluff: | 1.5 |
| Sherwood: | 0.7 |
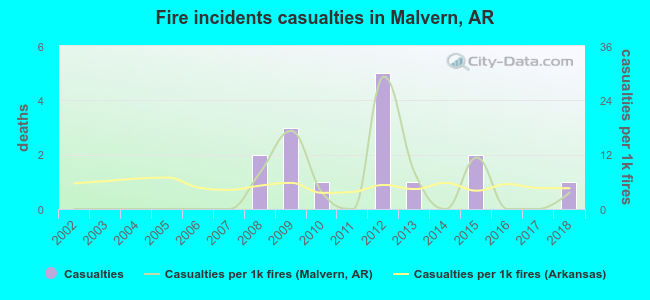 According to the data from the years 2002 - 2018 the average number of fire-related casualties per year is 1. The highest number of reported casualties - 5 took place in 2012, and the lowest - 0 in 2002. The data has a growing trend.
The average number of casualties per 1,000 fires is 5. This indicator was the highest - 29 in 2012, and the lowest 0 in 2002. The trend for injuries per 1,000 fire incidents is increasing. Compared to the Arkansas value the number of casualties per 1,000 incidents is about the same.
According to the data from the years 2002 - 2018 the average number of fire-related casualties per year is 1. The highest number of reported casualties - 5 took place in 2012, and the lowest - 0 in 2002. The data has a growing trend.
The average number of casualties per 1,000 fires is 5. This indicator was the highest - 29 in 2012, and the lowest 0 in 2002. The trend for injuries per 1,000 fire incidents is increasing. Compared to the Arkansas value the number of casualties per 1,000 incidents is about the same.Casualties per 1,000 incidents in Malvern, AR compared to nearest cities:
(Note: Based on data for all years, including only cities with at least 500 fire incidents)
| Malvern: | 5.0 |
| Hot Springs: | 4.7 |
| Benton: | 0.8 |
| Bauxite: | 0.0 |
| Arkadelphia: | 0.0 |
| Sheridan: | 2.2 |
| Bryant: | 3.5 |
| Alexander: | 3.5 |
| Hensley: | 0.0 |
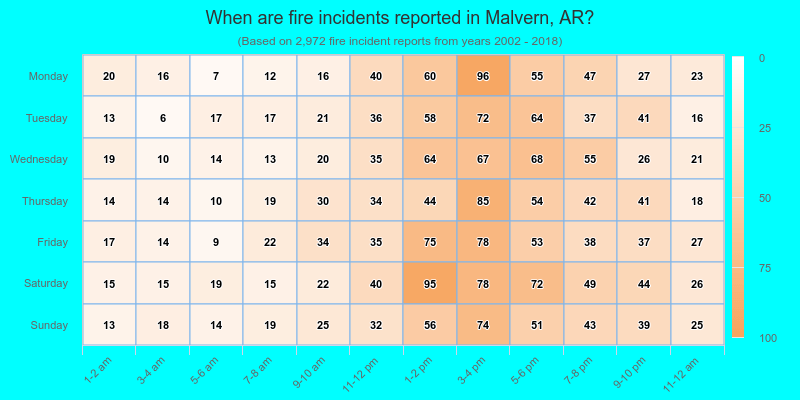
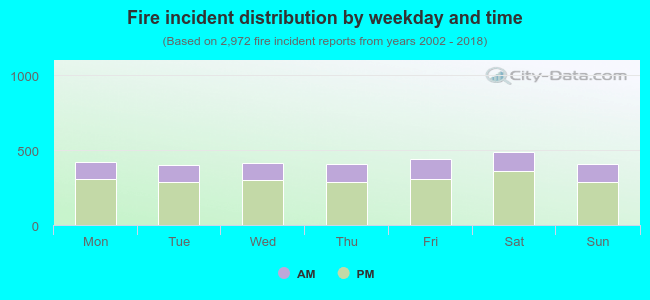 28.0% incidents where reported in the morning and 72.0% in the evening. The most fires (16.5%) took place on Saturday, and the least (13.4%) on Tuesday.
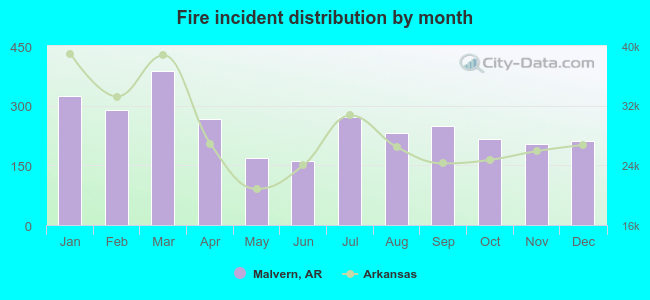 According to the 2,972 incident reports from years 2002 - 2018 most fires (13.0%) took place during March, and the least (5.4%) in June.
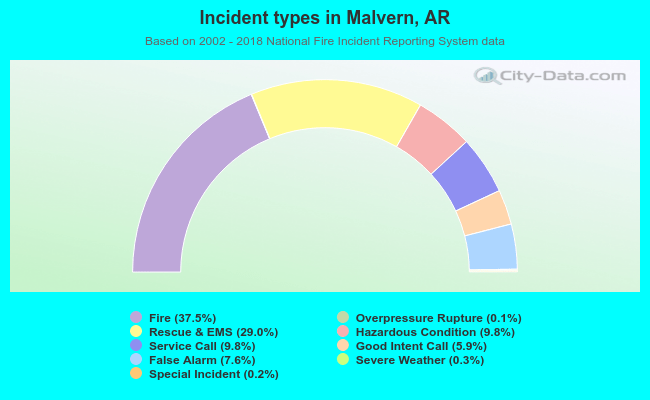 Out of all 7,932 cases reported during the years 2002 - 2018, the most belonged to the categories: Fire (37.5%), Rescue & EMS (29.0%), and Service Call (9.8%).
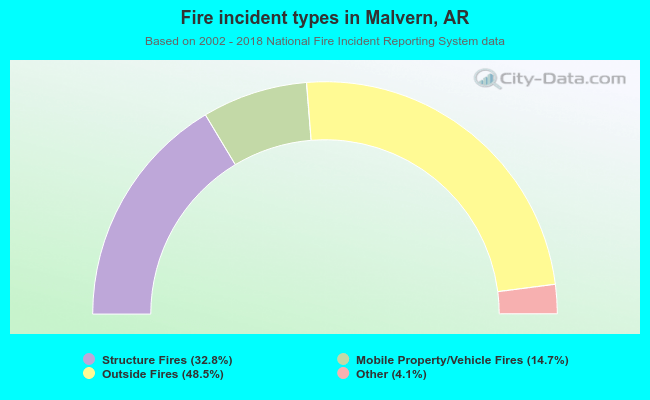 When looking into fire subcategories, the most reports belonged to: Outside Fires (48.5%), and Structure Fires (32.8%).