Lizella: Fire Incidents, Georgia (GA)
Where are fire incidents reported in Lizella, GA
Something went wrong! Please refresh the page.
|
| |||||||||||||||||||||||||||||||||||||||||||||||||||||||||||||||||||||||||||||||||||||||||||||||||||||||||||||
2005 - 2018 National Fire Incident Reporting System (NFIRS) incidents
- Incident types reported to NFIRS in Lizella, GA
- 84756.9%Rescue & EMS
- 29219.6%Fire
- 1268.5%False Alarm
- 745.0%Good Intent Call
- 734.9%Hazardous Condition
- 704.7%Service Call
- 60.4%Severe Weather
- Fire incident types reported to NFIRS in Lizella, GA
- 17760.6%Outside Fires
- 7425.3%Structure Fires
- 3712.7%Mobile Property/Vehicle Fires
- 41.4%Other
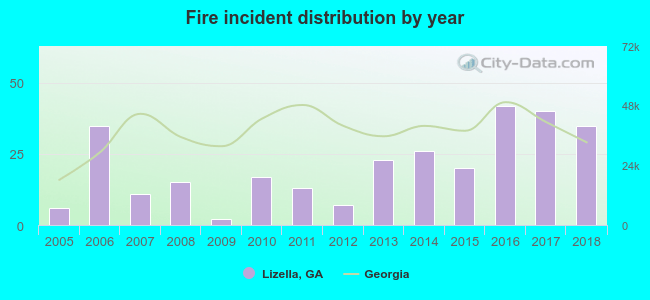 Based on the data from the years 2005 - 2018 the average number of fire incidents per year is 21. The highest number of reported fires - 42 took place in 2016, and the least - 2 in 2009. The data has a rising trend.
The average number of yearly fire incidents per 10k residents in Lizella, GA compared to nearest cities:
(Note: Based on data for the last 3 years, including only cities with population 5,000 and above)
| Lizella: | 21.5 |
| Macon: | 117.8 |
| Centerville: | 42.2 |
| Warner Robins: | 45.5 |
| Fort Valley: | 39.1 |
| Perry: | 66.9 |
| Barnesville: | 151.9 |
| Thomaston: | 152.7 |
| Milledgeville: | 136.4 |
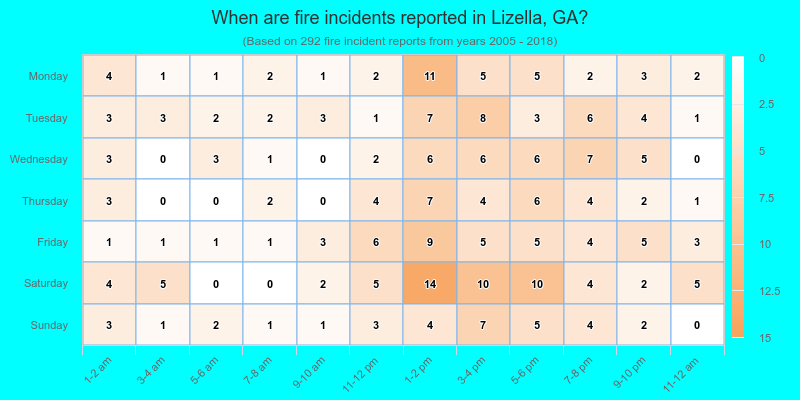
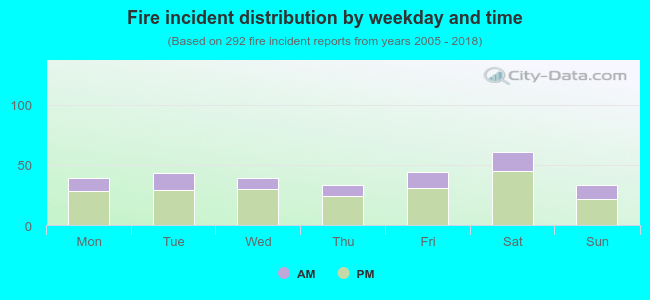 28.4% incidents where reported in the morning and 71.6% in the evening. The most fires (20.9%) took place on Saturday, and the least (11.3%) on Thursday.
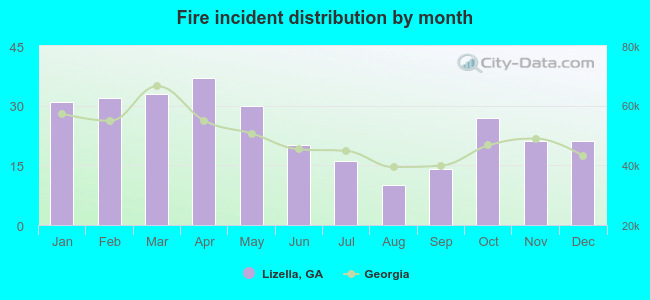 According to the 292 fires from years 2005 - 2018 most fires (12.7%) took place during April, and the least (3.4%) in August.
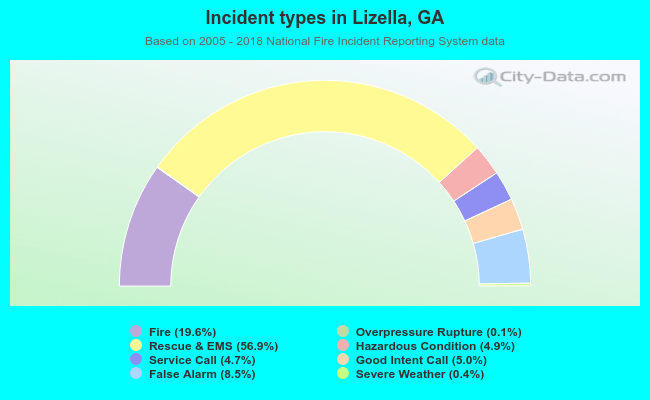 Out of all 1,489 cases reported during the years 2005 - 2018, the most belonged to the categories: Rescue & EMS (56.9%), Fire (19.6%), and False Alarm (8.5%).
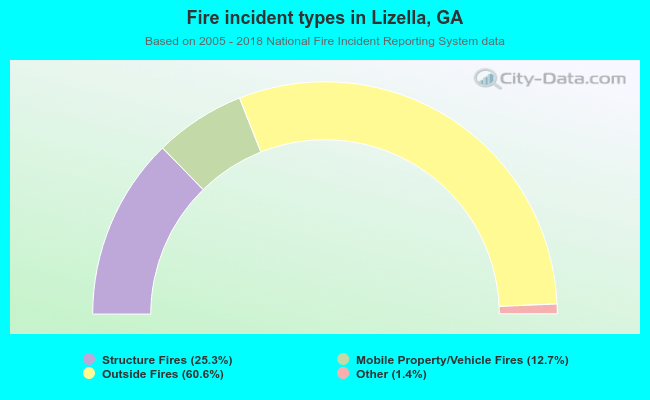 When looking into fire subcategories, the most reports belonged to: Outside Fires (60.6%), and Structure Fires (25.3%).