Lombard: Fire Incidents, Illinois (IL)
Where are fire incidents reported in Lombard, IL
Something went wrong! Please refresh the page.
| Fire incidents reported | |
|---|---|
| Sreet name | Count |
| ROOSEVELT RD | 270 |
| FINLEY RD | 206 |
| MAIN ST | 166 |
| HIGHLAND AVE | 150 |
| NORTH AVE | 134 |
| I 355 | 118 |
| YORKTOWN | 112 |
| ST CHARLES RD | 100 |
| 22ND ST | 92 |
| FAIRFIELD AVE | 86 |
| FOXWORTH BLVD | 76 |
| BUTTERFIELD RD | 68 |
| GRACE AVE | 62 |
| GRACE ST | 54 |
| WESTMORE AVE | 52 |
| MADISON ST | 48 |
| ELIZABETH ST | 46 |
| COLUMBINE AVE | 44 |
| GARFIELD ST | 42 |
| STEWART AVE | 42 |
| MEYERS RD | 40 |
| EDGEWOOD AVE | 38 |
| CHARLOTTE ST | 36 |
| CHASE AVE | 34 |
| FOUNTAIN SQUARE DR | 32 |
| LOMBARD AVE | 32 |
| MAPLE ST | 32 |
| WILLOW ST | 32 |
| ANN ST | 30 |
| AHRENS AVE | 28 |
2002 - 2018 National Fire Incident Reporting System (NFIRS) incidents
- Incident types reported to NFIRS in Lombard, IL
- 22,19259.5%Rescue & EMS
- 4,76012.8%Hazardous Condition
- 3,74010.0%False Alarm
- 2,5636.9%Service Call
- 2,2636.1%Fire
- 1,7054.6%Good Intent Call
- 390.1%Overpressure Rupture
- Fire incident types reported to NFIRS in Lombard, IL
- 1,07147.3%Structure Fires
- 82236.3%Outside Fires
- 30913.7%Mobile Property/Vehicle Fires
- 612.7%Other
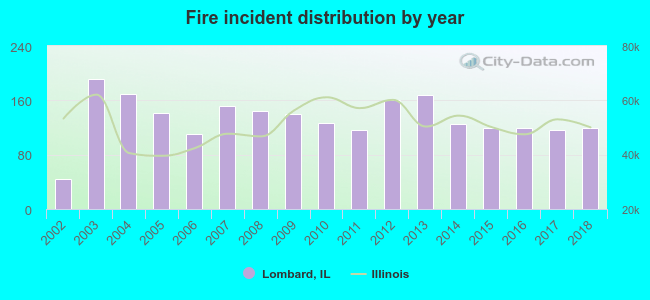 According to the data from the years 2002 - 2018 the average number of fire incidents per year is 133. The highest number of fire incidents - 192 took place in 2003, and the least - 44 in 2002. The data has a growing trend.
The average number of yearly fire incidents per 10k residents in Lombard, IL compared to nearest cities:
(Note: Based on data for the last 3 years, including only cities with population 5,000 and above)
| Lombard: | 27.0 |
| Villa Park: | 40.8 |
| Glen Ellyn: | 26.9 |
| Elmhurst: | 18.9 |
| Addison: | 33.4 |
| Oak Brook: | 71.9 |
| Glendale Heights: | 27.1 |
| Wheaton: | 18.3 |
| Berkeley: | 82.2 |
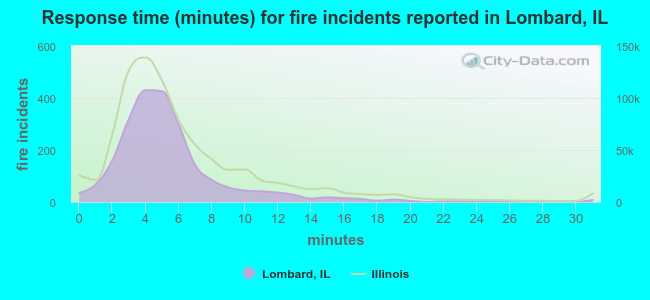 The median response time based on all reported fire incidents is 5 minutes. This is close to the state median value.
The median response time in Lombard, IL compared to nearest cities:
(Note: Based on data for all years, including only cities with at least 500 fire incidents)
| Lombard: | 5 minutes |
| Villa Park: | 4 minutes |
| Glen Ellyn: | 6 minutes |
| Elmhurst: | 5 minutes |
| Addison: | 5 minutes |
| Oak Brook: | 5 minutes |
| Glendale Heights: | 5 minutes |
| Wheaton: | 5 minutes |
| Berkeley: | 4 minutes |
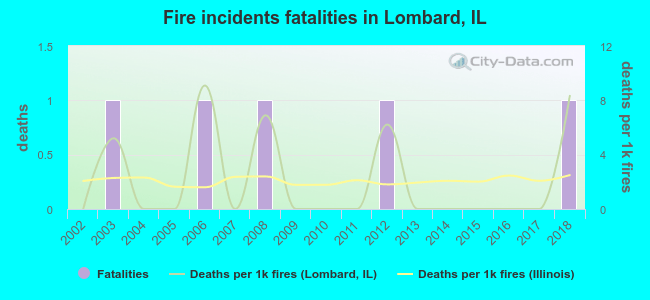 Based on the reports from the years 2002 - 2018 the average number of fire-related fatalities per year is 0. The highest number of reported deaths - 1 took place in 2003, and the lowest - 0 in 2002. The data has a growing trend.
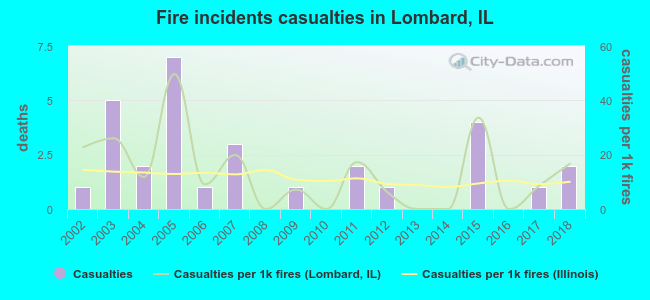 According to the reports from the years 2002 - 2018 the average number of fire-related casualties per year is 2. The highest number of casualties - 7 took place in 2005, and the lowest - 0 in 2008. The data has a rising trend.
The average number of injuries per 1,000 fire incidents is 13. This indicator was the highest - 50 in 2005, and the lowest 0 in 2008. The trend for injuries per 1,000 incidents is declining. Compared to the Illinois value the number of casualties per 1,000 incidents is about the same.
According to the reports from the years 2002 - 2018 the average number of fire-related casualties per year is 2. The highest number of casualties - 7 took place in 2005, and the lowest - 0 in 2008. The data has a rising trend.
The average number of injuries per 1,000 fire incidents is 13. This indicator was the highest - 50 in 2005, and the lowest 0 in 2008. The trend for injuries per 1,000 incidents is declining. Compared to the Illinois value the number of casualties per 1,000 incidents is about the same.Casualties per 1,000 incidents in Lombard, IL compared to nearest cities:
(Note: Based on data for all years, including only cities with at least 500 fire incidents)
| Lombard: | 13.3 |
| Villa Park: | 25.6 |
| Glen Ellyn: | 12.2 |
| Elmhurst: | 9.7 |
| Addison: | 15.0 |
| Oak Brook: | 10.9 |
| Glendale Heights: | 20.1 |
| Wheaton: | 12.6 |
| Berkeley: | 7.5 |
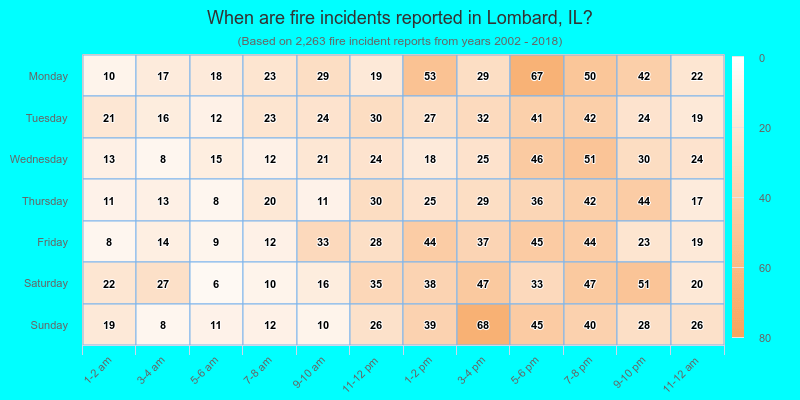
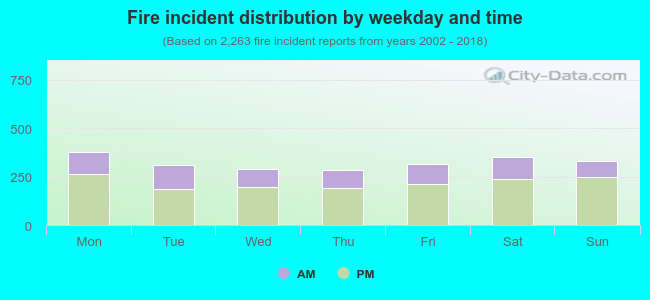 32.4% incidents where reported in the morning and 67.6% in the evening. The most fires (16.7%) took place on Monday, and the least (12.6%) on Thursday.
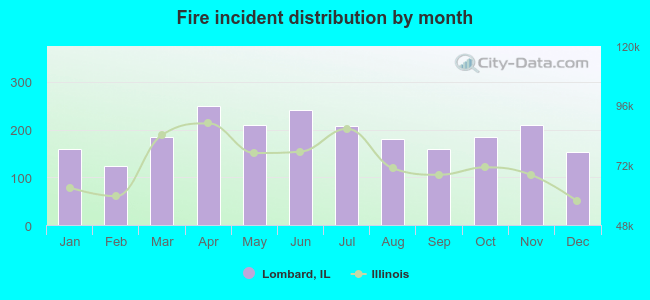 According to the 2,263 incident reports from years 2002 - 2018 most fires (11.0%) took place during April, and the least (5.4%) in February.
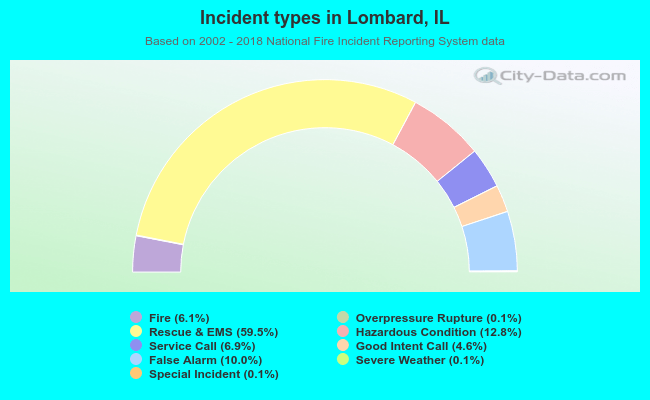 Out of all 37,326 cases reported during the years 2002 - 2018, the most belonged to the categories: Rescue & EMS (59.5%), Hazardous Condition (12.8%), and False Alarm (10.0%).
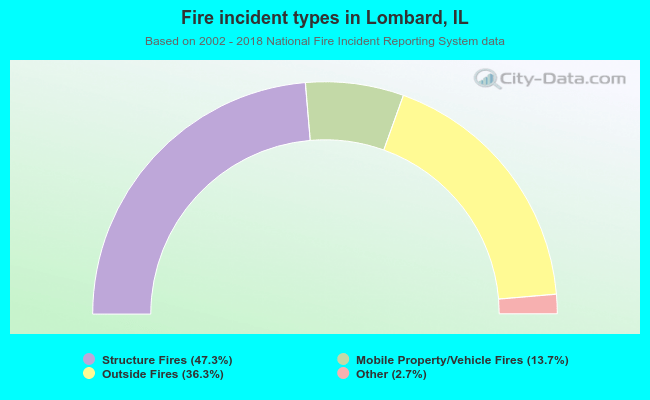 When looking into fire subcategories, the most incidents belonged to: Structure Fires (47.3%), and Outside Fires (36.3%).