Glen Ellyn: Fire Incidents, Illinois (IL)
Where are fire incidents reported in Glen Ellyn, IL
Something went wrong! Please refresh the page.
| Fire incidents reported | |
|---|---|
| Sreet name | Count |
| ROOSEVELT RD | 92 |
| DUANE ST | 44 |
| MAIN ST | 44 |
| ROOSEVELT RD | 44 |
| BRIAR ST | 36 |
| PARK | 30 |
| BUTTERFIELD RD | 26 |
| FOREST AVE | 26 |
| NORTH AVE | 26 |
| IL 53 | 22 |
| DIANE AVE | 20 |
| FOREST | 20 |
| SWIFT RD | 20 |
| CRESCENT BL | 18 |
| HILL AV | 18 |
| NEWTON AVE | 18 |
| PARK BLVD | 18 |
| MAIN ST | 16 |
| PARK BL | 16 |
| PARK BLVD | 16 |
| KENILWORTH AV | 14 |
| ROUTE 53 | 14 |
| BUSCH RD | 12 |
| CRESCENT BLVD | 12 |
| FAWELL BL | 12 |
| FAWELL BLVD | 12 |
| FOREST HILL DR | 12 |
| HIGHLAND AVE | 12 |
| PENNSYLVANIA AV | 12 |
| RAINTREE CT | 12 |
| Other | 292 |
2003 - 2018 National Fire Incident Reporting System (NFIRS) incidents
- Incident types reported to NFIRS in Glen Ellyn, IL
- 11,48064.5%Rescue & EMS
- 2,29412.9%Hazardous Condition
- 1,5338.6%False Alarm
- 9865.5%Fire
- 8764.9%Good Intent Call
- 6093.4%Service Call
- Fire incident types reported to NFIRS in Glen Ellyn, IL
- 54255.0%Structure Fires
- 32432.9%Outside Fires
- 979.8%Mobile Property/Vehicle Fires
- 232.3%Other
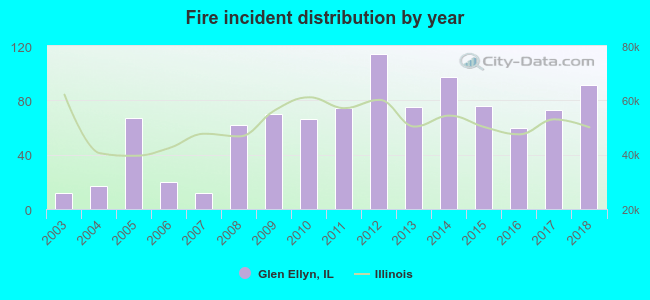 Based on the data from the years 2003 - 2018 the average number of fires per year is 62. The highest number of fires - 114 took place in 2012, and the least - 12 in 2003. The data has a growing trend.
The average number of yearly fire incidents per 10k residents in Glen Ellyn, IL compared to nearest cities:
(Note: Based on data for the last 3 years, including only cities with population 5,000 and above)
| Glen Ellyn: | 26.9 |
| Wheaton: | 18.3 |
| Lombard: | 27.0 |
| Glendale Heights: | 27.1 |
| Villa Park: | 40.8 |
| Winfield: | 33.8 |
| Addison: | 33.4 |
| Carol Stream: | 21.1 |
| Bloomingdale: | 34.5 |
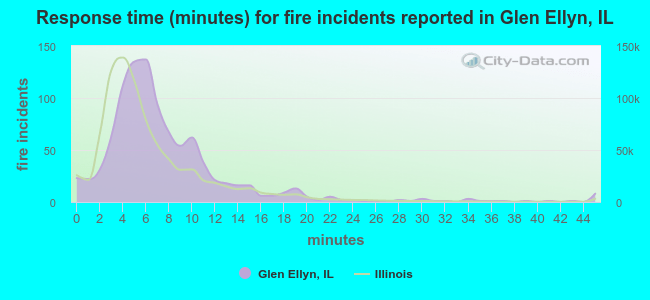 The median response time based on all reported fire incidents is 6 minutes. This is about the same as the state median value.
The median response time in Glen Ellyn, IL compared to nearest cities:
(Note: Based on data for all years, including only cities with at least 500 fire incidents)
| Glen Ellyn: | 6 minutes |
| Wheaton: | 5 minutes |
| Lombard: | 5 minutes |
| Glendale Heights: | 5 minutes |
| Villa Park: | 4 minutes |
| Winfield: | 5 minutes |
| Addison: | 5 minutes |
| Carol Stream: | 5 minutes |
| Bloomingdale: | 5 minutes |
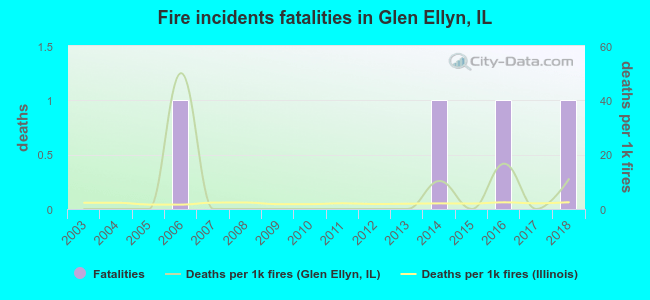 According to the data from the years 2003 - 2018 the average number of fire-related yearly deaths is 0. The highest number of reported deaths - 1 took place in 2006, and the lowest - 0 in 2003. The data has a rising trend.
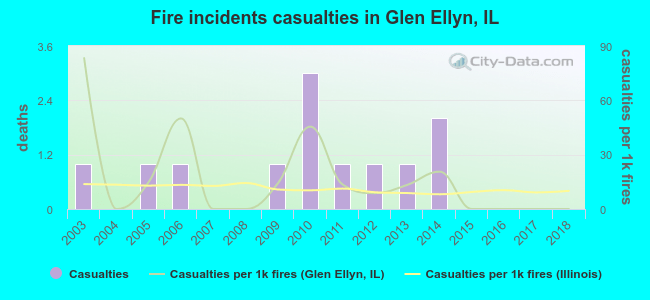 According to the reports from the years 2003 - 2018 the average number of fire-related yearly casualties is 1. The highest number of reported casualties - 3 took place in 2010, and the lowest - 0 in 2004. The data has a decreasing trend.
The average number of injuries per 1,000 fire incidents is 17. This indicator was the highest - 83 in 2003, and the lowest 0 in 2004. The trend for injuries per 1,000 incidents is decreasing. Compared to the state value the number of casualties per 1,000 fires is similar.
According to the reports from the years 2003 - 2018 the average number of fire-related yearly casualties is 1. The highest number of reported casualties - 3 took place in 2010, and the lowest - 0 in 2004. The data has a decreasing trend.
The average number of injuries per 1,000 fire incidents is 17. This indicator was the highest - 83 in 2003, and the lowest 0 in 2004. The trend for injuries per 1,000 incidents is decreasing. Compared to the state value the number of casualties per 1,000 fires is similar.Casualties per 1,000 incidents in Glen Ellyn, IL compared to nearest cities:
(Note: Based on data for all years, including only cities with at least 500 fire incidents)
| Glen Ellyn: | 12.2 |
| Wheaton: | 12.6 |
| Lombard: | 13.3 |
| Glendale Heights: | 20.1 |
| Villa Park: | 25.6 |
| Winfield: | 3.4 |
| Addison: | 15.0 |
| Carol Stream: | 7.4 |
| Bloomingdale: | 12.1 |
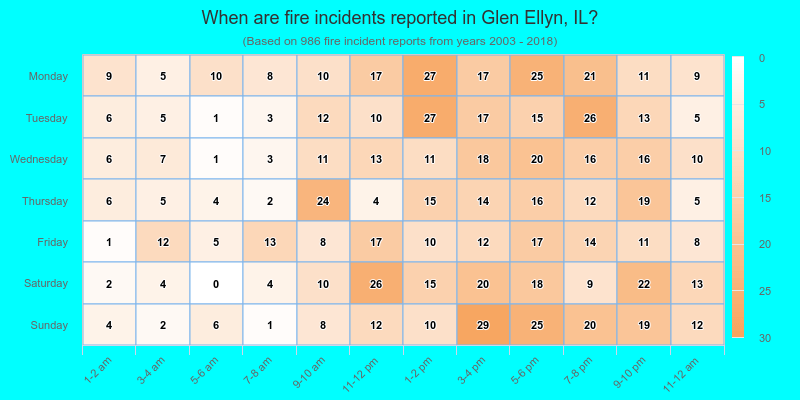
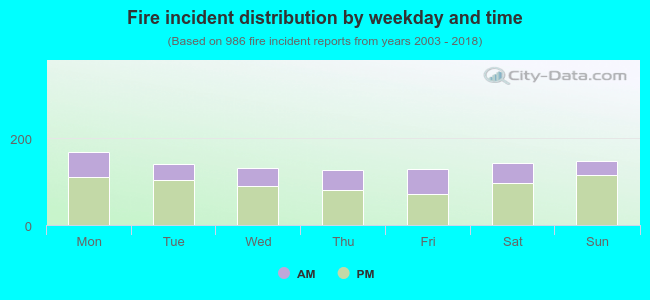 32.2% incidents where reported in the morning and 67.8% in the evening. The most fires (17.1%) took place on Monday, and the least (12.8%) on Thursday.
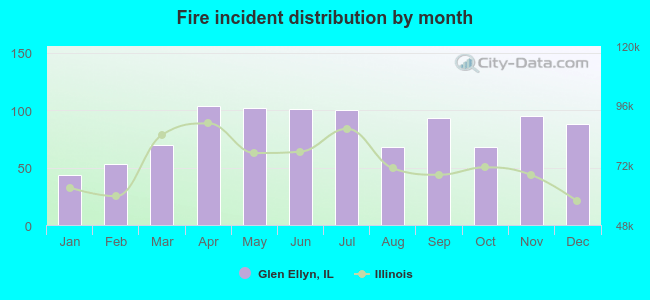 Based on the 986 incident reports from years 2003 - 2018 most fires (10.5%) took place during April, and the least (4.5%) in January.
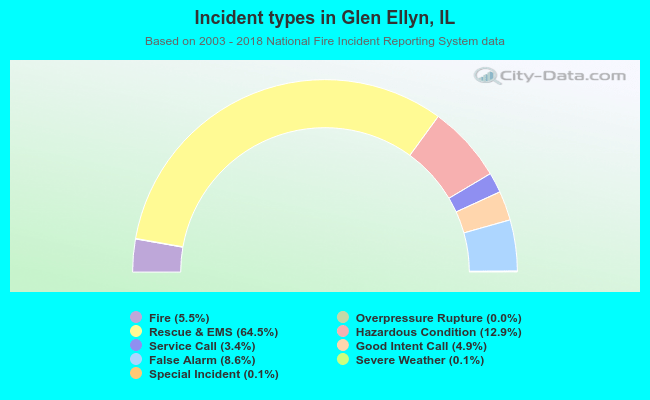 Out of all 17,805 cases reported during the years 2003 - 2018, the most belonged to the categories: Rescue & EMS (64.5%), Hazardous Condition (12.9%), and False Alarm (8.6%).
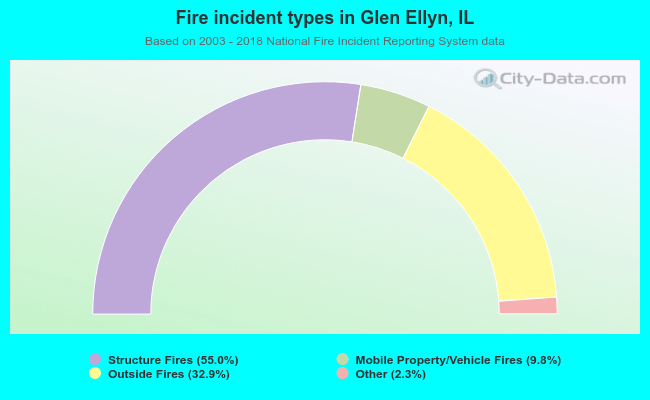 When looking into fire subcategories, the most reports belonged to: Structure Fires (55.0%), and Outside Fires (32.9%).