Long Beach: Fire Incidents, Mississippi (MS)
Where are fire incidents reported in Long Beach, MS
Something went wrong! Please refresh the page.
| Fire incidents reported | |
|---|---|
| Sreet name | Count |
| BEATLINE RD | 92 |
| RED CREEK RD | 36 |
| BEATLINE | 32 |
| 28TH ST | 30 |
| CLEVELAND AVE | 30 |
| DAUGHERTY | 30 |
| HWY 90 | 30 |
| KLONDYKE RD | 30 |
| TURNER RD | 26 |
| DAUGHERTY RD | 24 |
| THOMPSON RD | 24 |
| JOHNSON RD | 22 |
| OLD PASS | 22 |
| OLD PASS RD | 22 |
| PINEVILLE RD | 22 |
| LEGGETT RD | 20 |
| PINEVILLE | 20 |
| BASCH | 18 |
| COMMISSION | 18 |
| COMMISSION RD | 18 |
| INTERSTATE 10 HWY | 18 |
| KLONDYKE | 18 |
| 2ND ST | 16 |
| ISLAND VIEW AVE | 16 |
| 28 ST | 14 |
| ALEXANDER RD | 14 |
| ALLEN RD | 14 |
| COUNTY FARM RD | 14 |
| FREDDIE FRANK RD | 14 |
| RAILROAD | 14 |
| Other | 343 |
2002 - 2018 National Fire Incident Reporting System (NFIRS) incidents
- Incident types reported to NFIRS in Long Beach, MS
- 3,19247.8%Rescue & EMS
- 1,06115.9%Fire
- 84512.7%Hazardous Condition
- 83012.4%Good Intent Call
- 4056.1%False Alarm
- 2954.4%Service Call
- 200.3%Special Incident
- 190.3%Severe Weather
- 90.1%Overpressure Rupture
- Fire incident types reported to NFIRS in Long Beach, MS
- 44742.1%Outside Fires
- 37435.2%Structure Fires
- 15714.8%Mobile Property/Vehicle Fires
- 837.8%Other
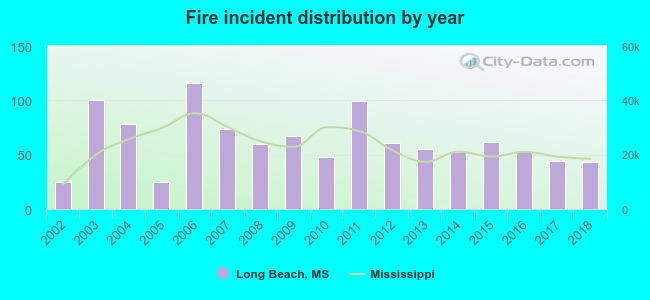 Based on the data from the years 2002 - 2018 the average number of fires per year is 62. The highest number of reported fires - 116 took place in 2006, and the least - 25 in 2002. The data has an increasing trend.
The average number of yearly fire incidents per 10k residents in Long Beach, MS compared to nearest cities:
(Note: Based on data for the last 3 years, including only cities with population 5,000 and above)
| Long Beach: | 30.0 |
| Pass Christian: | 159.5 |
| Gulfport: | 58.2 |
| Diamondhead: | 24.9 |
| Waveland: | 76.9 |
| Biloxi: | 53.3 |
| Ocean Springs: | 102.1 |
| Gautier: | 53.1 |
| Vancleave: | 115.5 |
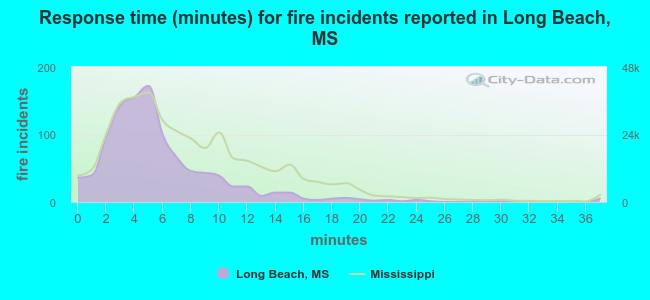 The median response time based on all reported fire incidents is 5 minutes. This is lower than the state median value.
The median response time in Long Beach, MS compared to nearest cities:
(Note: Based on data for all years, including only cities with at least 500 fire incidents)
| Long Beach: | 5 minutes |
| Pass Christian: | 6 minutes |
| Gulfport: | 5 minutes |
| Bay St. Louis: | 5 minutes |
| Waveland: | 4 minutes |
| Biloxi: | 4 minutes |
| Kiln: | 10 minutes |
| Saucier: | 8 minutes |
| Ocean Springs: | 4 minutes |
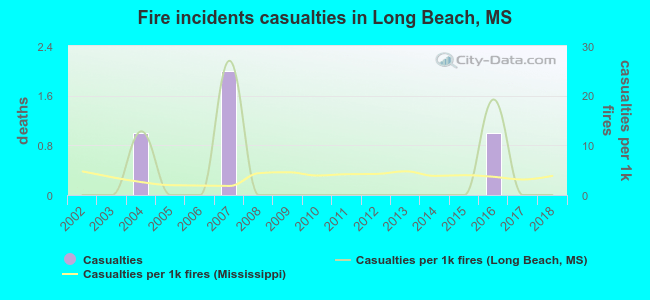 Based on the reports from the years 2002 - 2018 the average number of fire-related yearly casualties is 0. The highest number of injuries - 2 took place in 2007, and the lowest - 0 in 2002. The data has a constant trend.
The average number of casualties per 1,000 fires is 3. This indicator was the highest - 27 in 2007, and the lowest 0 in 2002. The trend for injuries per 1,000 fires is constant. Compared to the Mississippi value the number of injuries per 1,000 incidents is about the same.
Based on the reports from the years 2002 - 2018 the average number of fire-related yearly casualties is 0. The highest number of injuries - 2 took place in 2007, and the lowest - 0 in 2002. The data has a constant trend.
The average number of casualties per 1,000 fires is 3. This indicator was the highest - 27 in 2007, and the lowest 0 in 2002. The trend for injuries per 1,000 fires is constant. Compared to the Mississippi value the number of injuries per 1,000 incidents is about the same.Casualties per 1,000 incidents in Long Beach, MS compared to nearest cities:
(Note: Based on data for all years, including only cities with at least 500 fire incidents)
| Long Beach: | 3.8 |
| Pass Christian: | 3.0 |
| Gulfport: | 11.7 |
| Bay St. Louis: | 3.9 |
| Waveland: | 1.0 |
| Biloxi: | 15.1 |
| Kiln: | 3.4 |
| Saucier: | 6.3 |
| Ocean Springs: | 7.8 |
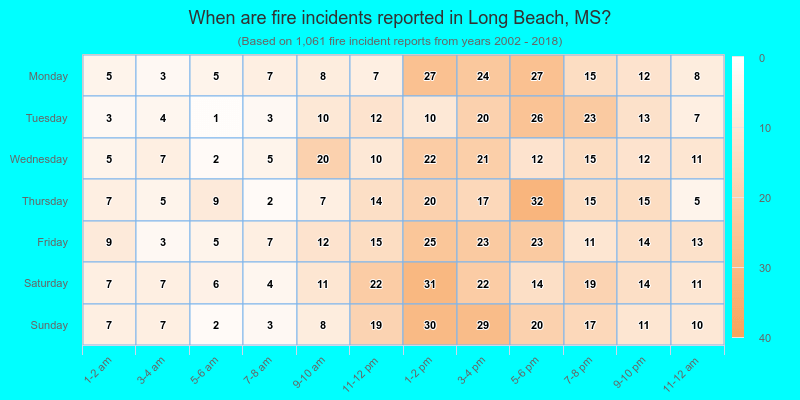
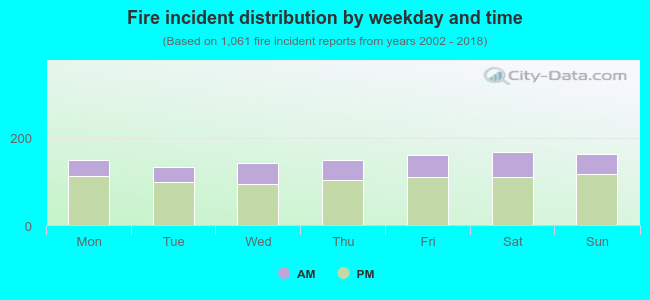 29.7% incidents where reported in the morning and 70.3% in the evening. The most fires (15.8%) took place on Saturday, and the least (12.4%) on Tuesday.
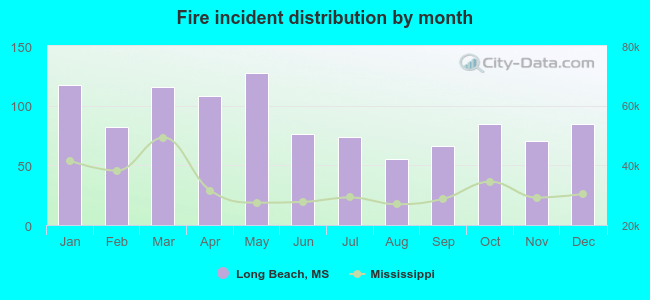 According to the 1,061 fire incidents from years 2002 - 2018 most fires (12.0%) took place during May, and the least (5.2%) in August.
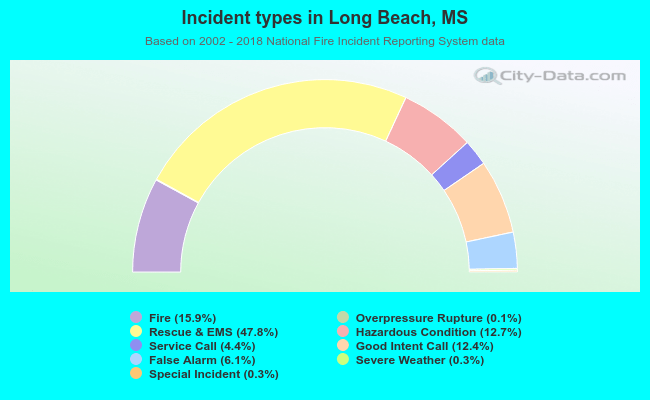 Out of all 6,676 cases reported during the years 2002 - 2018, the most belonged to the categories: Rescue & EMS (47.8%), Fire (15.9%), and Hazardous Condition (12.7%).
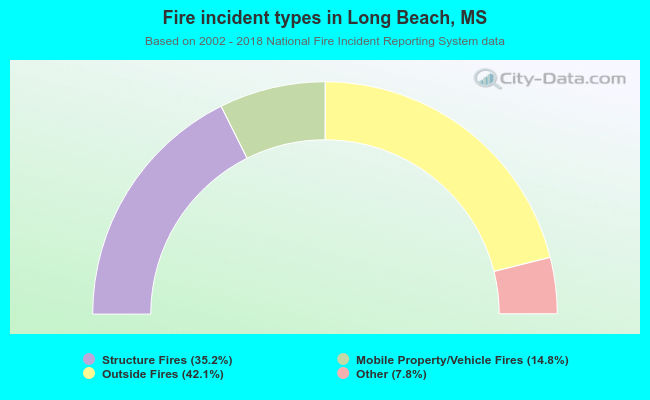 When looking into fire subcategories, the most reports belonged to: Outside Fires (42.1%), and Structure Fires (35.2%).