Ocean Springs: Fire Incidents, Mississippi (MS)
Where are fire incidents reported in Ocean Springs, MS
Something went wrong! Please refresh the page.
| Fire incidents reported | |
|---|---|
| Sreet name | Count |
| BIENVILLE BLVD | 344 |
| I-10 | 120 |
| WASHINGTON AVE | 118 |
| TUCKER RD | 86 |
| I10 | 80 |
| BEACHVIEW DR | 60 |
| GOVERNMENT ST | 58 |
| HWY 57 | 58 |
| OCEAN SPRINGS RD | 56 |
| INTERSTATE 10 | 54 |
| OLD FORT BAYOU RD | 54 |
| FRONT BEACH DR | 48 |
| OAK ST | 44 |
| PINEHURST DR | 44 |
| JIM RAMSEY RD | 38 |
| 8TH ST | 36 |
| BEACH ST | 36 |
| SEAMAN RD | 36 |
| I10 HWY | 34 |
| SHELBY LN | 34 |
| CUMBERLAND RD | 32 |
| HWY 609 | 32 |
| LEMOYNE | 30 |
| NOBLE RD | 30 |
| 11TH ST | 28 |
| 9TH ST | 28 |
| BIENVILLE | 28 |
| HANLEY RD | 28 |
| LARUE RD | 28 |
| LEMOYNE BLVD | 28 |
| Other | 2,622 |
2002 - 2018 National Fire Incident Reporting System (NFIRS) incidents
- Incident types reported to NFIRS in Ocean Springs, MS
- 7,04642.1%Rescue & EMS
- 4,35226.0%Fire
- 1,71410.2%Hazardous Condition
- 1,3518.1%Service Call
- 1,1777.0%Good Intent Call
- 1,0076.0%False Alarm
- 410.2%Severe Weather
- 180.1%Special Incident
- 170.1%Overpressure Rupture
- Fire incident types reported to NFIRS in Ocean Springs, MS
- 2,27552.3%Outside Fires
- 1,23428.4%Structure Fires
- 72716.7%Mobile Property/Vehicle Fires
- 1162.7%Other
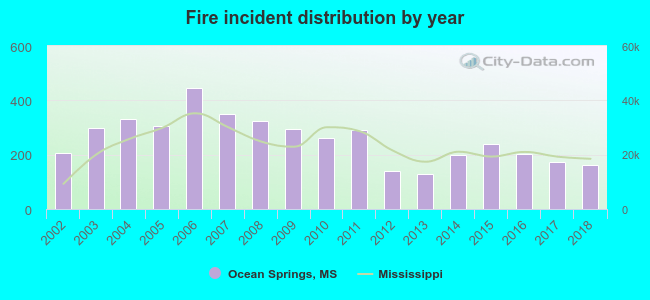 According to the data from the years 2002 - 2018 the average number of fires per year is 256. The highest number of fire incidents - 445 took place in 2006, and the least - 128 in 2013. The data has a decreasing trend.
The average number of yearly fire incidents per 10k residents in Ocean Springs, MS compared to nearest cities:
(Note: Based on data for the last 3 years, including only cities with population 5,000 and above)
| Ocean Springs: | 102.1 |
| Biloxi: | 53.3 |
| Gautier: | 53.1 |
| Vancleave: | 115.5 |
| Pascagoula: | 45.6 |
| Moss Point: | 160.4 |
| Gulfport: | 58.2 |
| Long Beach: | 30.0 |
| Pass Christian: | 159.5 |
 The median response time based on all reported fire incidents is 4 minutes. This is lower than the Mississippi median value.
The median response time in Ocean Springs, MS compared to nearest cities:
(Note: Based on data for all years, including only cities with at least 500 fire incidents)
| Ocean Springs: | 4 minutes |
| Biloxi: | 4 minutes |
| Gautier: | 4 minutes |
| Vancleave: | 9 minutes |
| Pascagoula: | 3 minutes |
| Moss Point: | 5 minutes |
| Gulfport: | 5 minutes |
| Long Beach: | 5 minutes |
| Hurley: | 7 minutes |
 According to the data from the years 2002 - 2018 the average number of fire-related yearly deaths is 0. The highest number of deaths - 2 took place in 2007, and the lowest - 0 in 2002. The data has a rising trend.
The average number of deaths per 1,000 fires is 1. This indicator was the highest - 6 in 2018, and the lowest 0 in 2002. The trend for deaths per 1,000 fires is rising. Compared to the Mississippi value the number of deaths per 1,000 incidents is much lower.
According to the data from the years 2002 - 2018 the average number of fire-related yearly deaths is 0. The highest number of deaths - 2 took place in 2007, and the lowest - 0 in 2002. The data has a rising trend.
The average number of deaths per 1,000 fires is 1. This indicator was the highest - 6 in 2018, and the lowest 0 in 2002. The trend for deaths per 1,000 fires is rising. Compared to the Mississippi value the number of deaths per 1,000 incidents is much lower.Deaths per 1,000 incidents in Ocean Springs, MS compared to nearest cities:
(Note: Based on data for all years, including only cities with at least 2,500 fire incidents)
| Ocean Springs: | 1.1 |
| Biloxi: | 1.5 |
| Pascagoula: | 2.6 |
| Moss Point: | 2.2 |
| Gulfport: | 2.3 |
| Saucier: | 2.0 |
| Lucedale: | 1.9 |
| Mobile: | 0.9 |
| Picayune: | 2.7 |
 Based on the reports from the years 2002 - 2018 the average number of fire-related casualties per year is 2. The highest number of reported injuries - 10 took place in 2016, and the lowest - 0 in 2005. The data has a constant trend.
The average number of injuries per 1,000 fire incidents is 8. This indicator was the highest - 50 in 2016, and the lowest 0 in 2005. The trend for injuries per 1,000 fires is increasing. Compared to the state value the number of injuries per 1,000 fire incidents is much higher.
Based on the reports from the years 2002 - 2018 the average number of fire-related casualties per year is 2. The highest number of reported injuries - 10 took place in 2016, and the lowest - 0 in 2005. The data has a constant trend.
The average number of injuries per 1,000 fire incidents is 8. This indicator was the highest - 50 in 2016, and the lowest 0 in 2005. The trend for injuries per 1,000 fires is increasing. Compared to the state value the number of injuries per 1,000 fire incidents is much higher.Casualties per 1,000 incidents in Ocean Springs, MS compared to nearest cities:
(Note: Based on data for all years, including only cities with at least 500 fire incidents)
| Ocean Springs: | 7.8 |
| Biloxi: | 15.1 |
| Gautier: | 17.6 |
| Vancleave: | 6.0 |
| Pascagoula: | 0.7 |
| Moss Point: | 3.4 |
| Gulfport: | 11.7 |
| Long Beach: | 3.8 |
| Hurley: | 7.3 |
 30.0% incidents where reported in the morning and 70.0% in the evening. The most fires (16.4%) took place on Sunday, and the least (13.5%) on Saturday.
 Based on the 4,352 fire incident reports from years 2002 - 2018 most fires (10.3%) took place during January, and the least (6.7%) in August.
 Out of all 16,723 cases reported during the years 2002 - 2018, the most belonged to the categories: Rescue & EMS (42.1%), Fire (26.0%), and Hazardous Condition (10.2%).
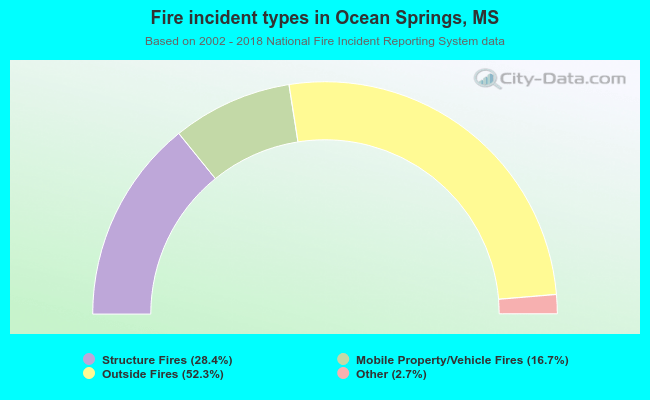 When looking into fire subcategories, the most incidents belonged to: Outside Fires (52.3%), and Structure Fires (28.4%).