Louisville: Fire Incidents, Georgia (GA)
Where are fire incidents reported in Louisville, GA
Something went wrong! Please refresh the page.
|
| |||||||||||||||||||||||||||||||||||||||||||||||||||||||||||||||||||||||||||||||||||||||||||||||||||||||||||||
| Other | 141 | |||||||||||||||||||||||||||||||||||||||||||||||||||||||||||||||||||||||||||||||||||||||||||||||||||||||||||||
2004 - 2018 National Fire Incident Reporting System (NFIRS) incidents
- Incident types reported to NFIRS in Louisville, GA
- 53557.8%Fire
- 25527.6%Hazardous Condition
- 788.4%Rescue & EMS
- 283.0%Good Intent Call
- 192.1%Service Call
- 60.6%False Alarm
- 40.4%Special Incident
- Fire incident types reported to NFIRS in Louisville, GA
- 26048.6%Outside Fires
- 19035.5%Structure Fires
- 7113.3%Mobile Property/Vehicle Fires
- 142.6%Other
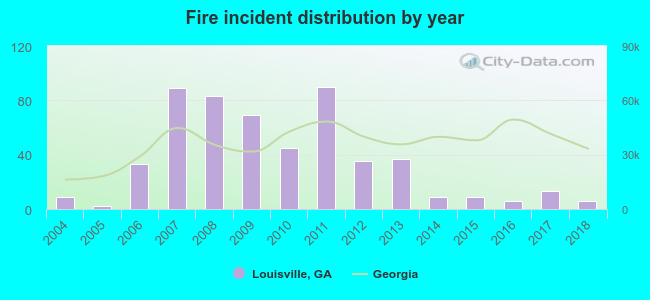 Based on the data from the years 2004 - 2018 the average number of fires per year is 36. The highest number of fires - 90 took place in 2011, and the least - 2 in 2005. The data has a declining trend.
 The median response time based on all reported fire incidents is 5 minutes. This is lower than the Georgia median value.
The median response time in Louisville, GA compared to nearest cities:
(Note: Based on data for all years, including only cities with at least 500 fire incidents)
| Louisville: | 5 minutes |
| Wrens: | 5 minutes |
| Waynesboro: | 4 minutes |
| Sandersville: | 4 minutes |
| Wrightsville: | 10 minutes |
| Hephzibah: | 6 minutes |
| Swainsboro: | 8 minutes |
| Millen: | 10 minutes |
| Warrenton: | 12 minutes |
 29.5% incidents where reported in the morning and 70.5% in the evening. The most fires (17.4%) took place on Saturday, and the least (11.4%) on Tuesday.
 According to the 535 fire incidents from years 2004 - 2018 most fires (12.5%) took place during January, and the least (4.7%) in October.
 Out of all 925 cases reported during the years 2004 - 2018, the most belonged to the categories: Fire (57.8%), Rescue & EMS (27.6%), and Overpressure Rupture (8.4%).
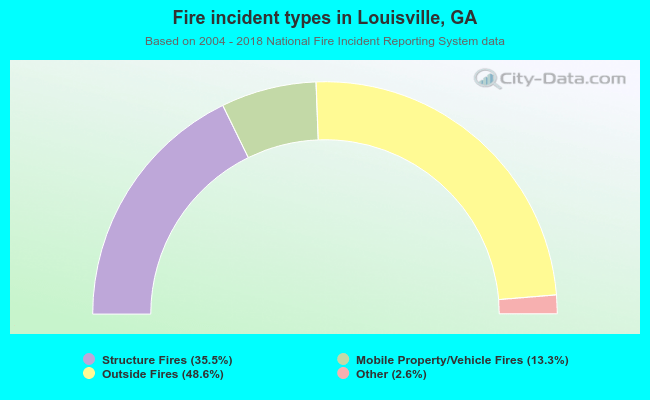 When looking into fire subcategories, the most incidents belonged to: Outside Fires (48.6%), and Structure Fires (35.5%).