Wrens: Fire Incidents, Georgia (GA)
Where are fire incidents reported in Wrens, GA
Something went wrong! Please refresh the page.
|
| |||||||||||||||||||||||||||||||||||||||||||||||||||||||||||||||||||||||||||||||||||||||||||||||||||||||||||||
2002 - 2018 National Fire Incident Reporting System (NFIRS) incidents
- Incident types reported to NFIRS in Wrens, GA
- 98544.9%Rescue & EMS
- 79736.3%Fire
- 1667.6%Hazardous Condition
- 1195.4%Good Intent Call
- 703.2%False Alarm
- 512.3%Service Call
- 60.3%Severe Weather
- Fire incident types reported to NFIRS in Wrens, GA
- 37847.4%Outside Fires
- 27834.9%Structure Fires
- 11514.4%Mobile Property/Vehicle Fires
- 263.3%Other
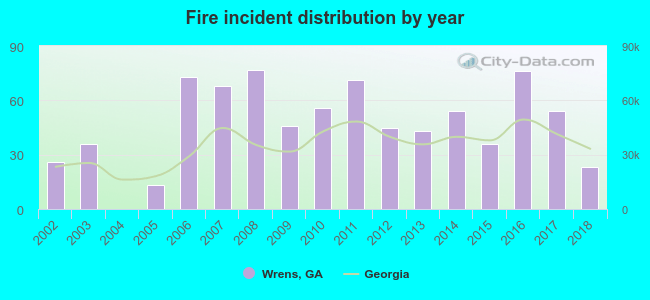 According to the data from the years 2002 - 2018 the average number of fire incidents per year is 47. The highest number of reported fire incidents - 77 took place in 2008, and the least - 0 in 2004. The data has a declining trend.
 The median response time based on all reported fire incidents is 5 minutes. This is lower compared to the state median value.
The median response time in Wrens, GA compared to nearest cities:
(Note: Based on data for all years, including only cities with at least 500 fire incidents)
| Wrens: | 5 minutes |
| Louisville: | 5 minutes |
| Hephzibah: | 6 minutes |
| Thomson: | 6 minutes |
| Grovetown: | 5 minutes |
| Warrenton: | 12 minutes |
| Waynesboro: | 4 minutes |
| Evans: | 5 minutes |
| Martinez: | 5 minutes |
 29.6% incidents where reported in the morning and 70.4% in the evening. The most fires (15.9%) took place on Saturday, and the least (11.9%) on Friday.
 According to the 797 fire incident reports from years 2002 - 2018 most fires (11.5%) took place during February, and the least (4.1%) in September.
 Out of all 2,196 cases reported during the years 2002 - 2018, the most belonged to the categories: Rescue & EMS (44.9%), Fire (36.3%), and Hazardous Condition (7.6%).
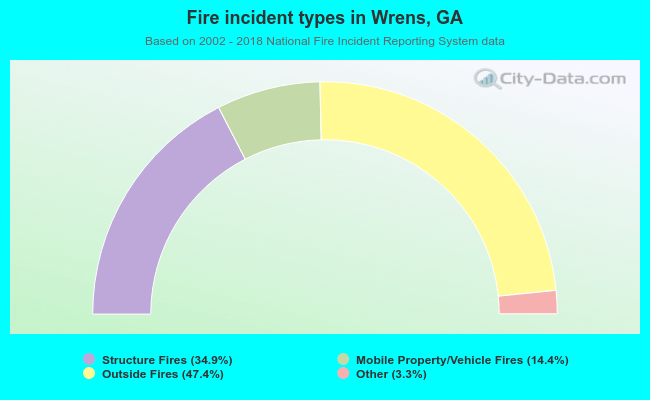 When looking into fire subcategories, the most incidents belonged to: Outside Fires (47.4%), and Structure Fires (34.9%).