| Fire incidents reported |
|---|
| Sreet name | Count |
|---|
| NUGENT RD | 14 | | LUMMI SHORE DR | 10 | | LEGOE BAY RD | 8 | | SEACREST DR | 8 | | WEST SHORE DR | 8 | | CONSTITUTION RD | 6 | | ISLAND VIEW DR | 6 | | SHORE DR | 6 | | SUNRISE RD | 6 | | CAGEY RD | 4 | | CEDAR AVE | 4 | | CENTERVIEW RD | 4 | | ISLAND DR | 4 | | JAMISON RD | 4 | | LEGOE BAY RD | 4 | | LENA RD | 4 | | LUMMI SHORE RD | 4 | | MACKENZIE RD | 4 | | MATIA VIEW DR | 4 | | N NUGENT | 4 | | N NUGENT RD | 4 | | S NUGENT RD | 4 | | SEACREST DR | 4 | | SHORE | 4 | | SMOKEHOUSE RD | 4 |
| | | Fire incidents reported |
|---|
| Sreet name | Count |
|---|
| SUNNY HILL LN | 4 | | TUTTLE LN | 4 | | WEST SHORE DR | 4 | | BALCH RD | 2 | | BALCH RD DEAD END | 2 | | BAY SHORE DR SHOREWOOD LN | 2 | | BEACH AVE | 2 | | BLIZARD DR | 2 | | BLIZZARD RD | 2 | | BLOCK HAXTON WAY | 2 | | BLOCK LIGHTNING BIRD LN | 2 | | BLOCK LUMMI VIEW DR | 2 | | BLOCK SALMON RD | 2 | | CAGEY RD CHIEF MARTIN RD | 2 | | CHIEF MARTIN RD SCOTT RD BE RD | 2 | | CONSTITUTION | 2 | | CONSTITUTION ROAD | 2 | | DANA CIRCLE | 2 | | DECATUR DR | 2 | | DOGWOOD TERRACE | 2 | | DOGWOOD TR | 2 | | GALER PLACE | 2 | | GRANGER WAY | 2 | | HALES PASSAGE DR | 2 | | |
|
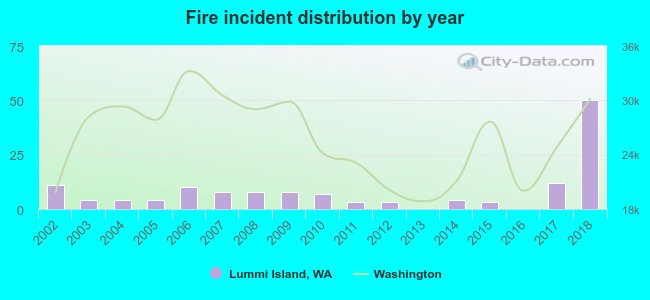 According to the data from the years 2002 - 2018 the average number of fire incidents per year is 8. The highest number of reported fires - 50 took place in 2018, and the least - 0 in 2013. The data has a rising trend.
 30.2% incidents where reported in the morning and 69.8% in the evening. The most fires (18.0%) took place on Tuesday, and the least (10.1%) on Wednesday.
 According to the 139 fire incidents from years 2002 - 2018 most fires (15.1%) took place during July, and the least (4.3%) in April.
 Out of all 1,496 cases reported during the years 2002 - 2018, the most belonged to the categories: Overpressure Rupture (74.5%), Fire (9.3%), and Service Call (5.1%).
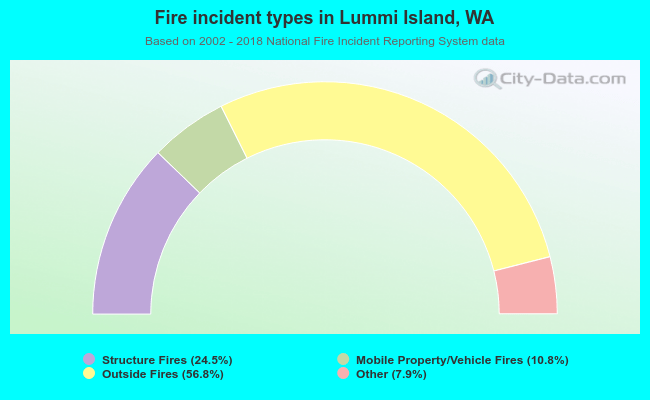 When looking into fire subcategories, the most reports belonged to: Outside Fires (56.8%), and Structure Fires (24.5%).