Madbury: Fire Incidents, New Hampshire (NH)
Where are fire incidents reported in Madbury, NH
Something went wrong! Please refresh the page.
|
| |||||||||||||||||||||||||||||||||||||||||||||||||||||||||||||||||||||||||||||||||||||||||||||||||||||||||||||
2003 - 2018 National Fire Incident Reporting System (NFIRS) incidents
- Incident types reported to NFIRS in Madbury, NH
- 53943.4%Rescue & EMS
- 23418.8%Hazardous Condition
- 14912.0%Service Call
- 13110.5%Fire
- 937.5%False Alarm
- 897.2%Good Intent Call
- 40.3%Severe Weather
- 20.2%Overpressure Rupture
- 20.2%Special Incident
- Fire incident types reported to NFIRS in Madbury, NH
- 5844.3%Outside Fires
- 5239.7%Structure Fires
- 1813.7%Mobile Property/Vehicle Fires
- 32.3%Other
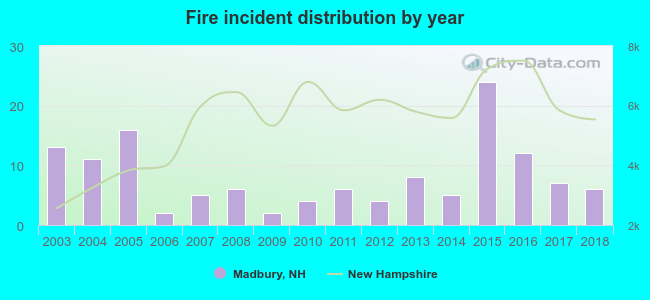 According to the data from the years 2003 - 2018 the average number of fires per year is 8. The highest number of fire incidents - 24 took place in 2015, and the least - 2 in 2006. The data has a declining trend.
 36.6% incidents where reported in the morning and 63.4% in the evening. The most fires (25.2%) took place on Saturday, and the least (10.7%) on Monday.
 According to the 131 incident reports from years 2003 - 2018 most fires (19.8%) took place during April, and the least (1.5%) in December.
 Out of all 1,243 cases reported during the years 2003 - 2018, the most belonged to the categories: Rescue & EMS (43.4%), Hazardous Condition (18.8%), and Service Call (12.0%).
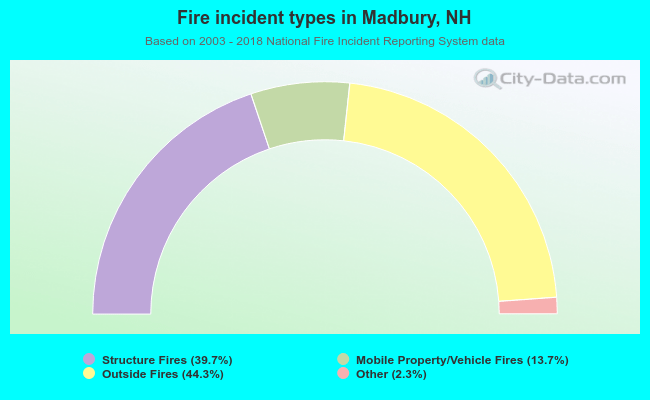 When looking into fire subcategories, the most incidents belonged to: Outside Fires (44.3%), and Structure Fires (39.7%).