Madison: Fire Incidents, Indiana (IN)
Where are fire incidents reported in Madison, IN
Something went wrong! Please refresh the page.
| Fire incidents reported | |
|---|---|
| Sreet name | Count |
| CLIFTY DR | 118 |
| SECOND ST | 92 |
| MICHIGAN RD | 66 |
| MAIN ST | 54 |
| WALNUT ST | 46 |
| WEST SECOND STREET | 40 |
| THIRD ST | 32 |
| IVY TECH DR | 30 |
| TAFT DR | 30 |
| LANIER DR | 28 |
| EAST ST | 26 |
| MULBERRY ST | 22 |
| CRAGMONT ST | 20 |
| FIRST ST | 20 |
| GRAHAM RD | 20 |
| GREEN RD | 20 |
| U.S. 421 | 20 |
| US 421 | 20 |
| VAUGHN DR | 20 |
| WILSON AVE | 18 |
| ALLEN ST | 14 |
| DEPUTY PIKE | 14 |
| FOURTH ST | 14 |
| STATE RD 62 | 14 |
| STATE ROAD 7 | 14 |
| BROADWAY ST | 12 |
| CROSS RD | 12 |
| GEYMAN HILL RD | 12 |
| ST RD 56 HWY | 12 |
| STATE RD 7 | 12 |
| Other | 421 |
2002 - 2017 National Fire Incident Reporting System (NFIRS) incidents
- Incident types reported to NFIRS in Madison, IN
- 1,29338.7%Fire
- 73622.0%Rescue & EMS
- 63619.0%Hazardous Condition
- 3079.2%Service Call
- 2106.3%False Alarm
- 1253.7%Good Intent Call
- 170.5%Special Incident
- 110.3%Severe Weather
- 80.2%Overpressure Rupture
- Fire incident types reported to NFIRS in Madison, IN
- 59245.8%Structure Fires
- 38129.5%Outside Fires
- 24318.8%Mobile Property/Vehicle Fires
- 776.0%Other
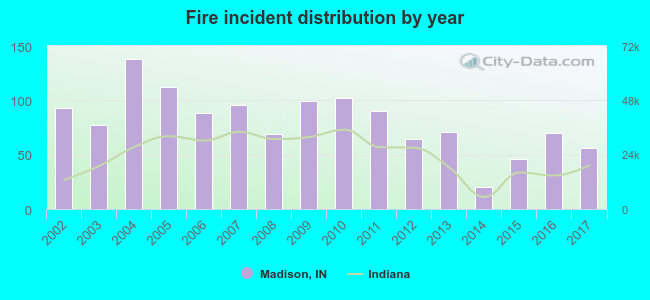 Based on the data from the years 2002 - 2017 the average number of fires per year is 81. The highest number of reported fire incidents - 138 took place in 2004, and the least - 20 in 2014. The data has a declining trend.
The average number of yearly fire incidents per 10k residents in Madison, IN compared to nearest cities:
(Note: Based on data for the last 3 years, including only cities with population 5,000 and above)
| Madison: | 35.5 |
| Scottsburg: | 4.0 |
| North Vernon: | 104.0 |
| Charlestown: | 29.0 |
| Seymour: | 27.2 |
| Sellersburg: | 36.8 |
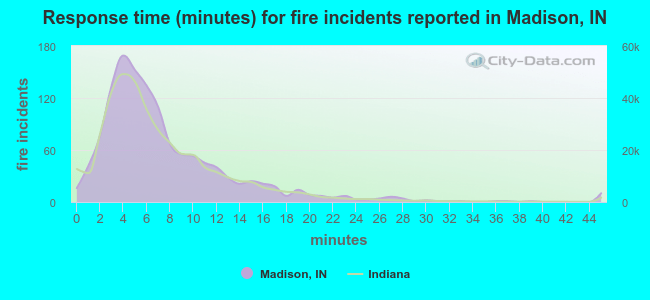 The median response time based on all reported fire incidents is 6 minutes. This is about the same as the state median value.
The median response time in Madison, IN compared to nearest cities:
(Note: Based on data for all years, including only cities with at least 500 fire incidents)
| Madison: | 6 minutes |
| Scottsburg: | 5 minutes |
| North Vernon: | 9 minutes |
| Charlestown: | 7 minutes |
| Seymour: | 4 minutes |
| Sellersburg: | 6 minutes |
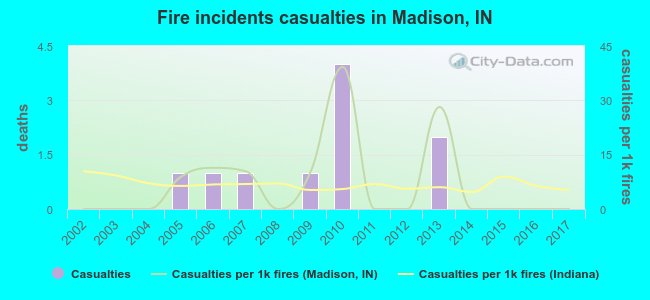 According to the data from the years 2002 - 2017 the average number of fire-related yearly casualties is 1. The highest number of casualties - 4 took place in 2010, and the lowest - 0 in 2002. The data has a constant trend.
The average number of casualties per 1,000 fire incidents is 7. This indicator was the highest - 39 in 2010, and the lowest 0 in 2002. The trend for injuries per 1,000 incidents is constant. Compared to the state value the number of injuries per 1,000 fires is similar.
According to the data from the years 2002 - 2017 the average number of fire-related yearly casualties is 1. The highest number of casualties - 4 took place in 2010, and the lowest - 0 in 2002. The data has a constant trend.
The average number of casualties per 1,000 fire incidents is 7. This indicator was the highest - 39 in 2010, and the lowest 0 in 2002. The trend for injuries per 1,000 incidents is constant. Compared to the state value the number of injuries per 1,000 fires is similar.Casualties per 1,000 incidents in Madison, IN compared to nearest cities:
(Note: Based on data for all years, including only cities with at least 500 fire incidents)
| Madison: | 7.7 |
| Scottsburg: | 11.7 |
| North Vernon: | 0.0 |
| Charlestown: | 1.2 |
| Seymour: | 0.6 |
| Sellersburg: | 10.5 |
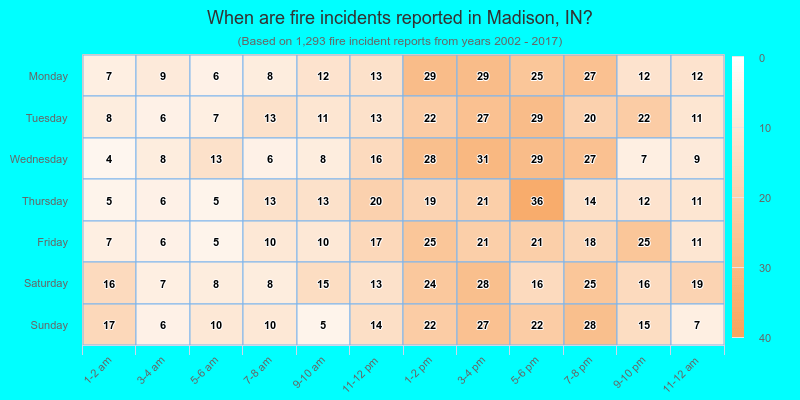
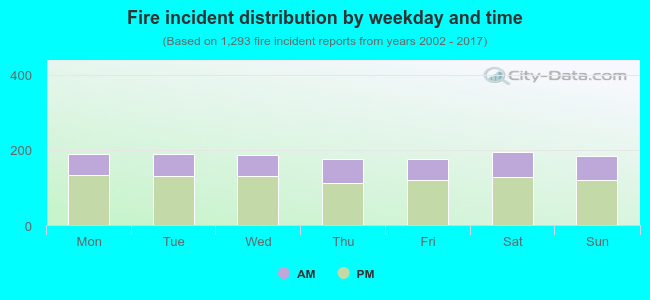 32.0% incidents where reported in the morning and 68.0% in the evening. The most fires (15.1%) took place on Saturday, and the least (13.5%) on Thursday.
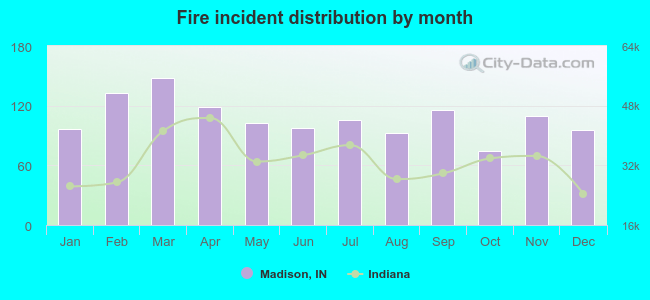 According to the 1,293 incident reports from years 2002 - 2017 most fires (11.4%) took place during March, and the least (5.7%) in October.
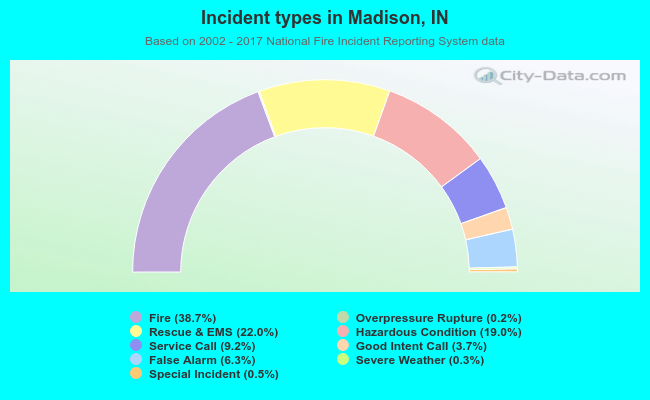 Out of all 3,343 cases reported during the years 2002 - 2017, the most belonged to the categories: Fire (38.7%), Rescue & EMS (22.0%), and Hazardous Condition (19.0%).
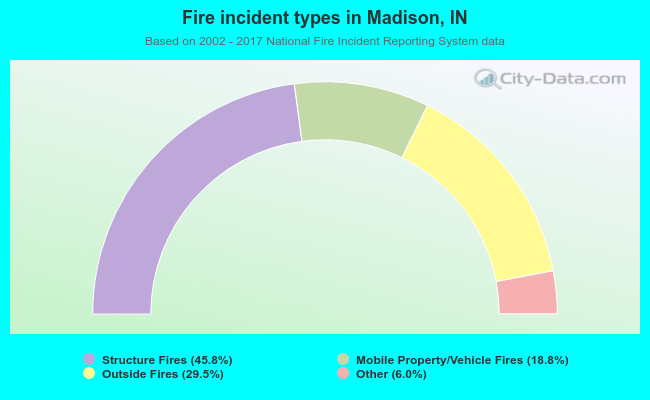 When looking into fire subcategories, the most reports belonged to: Structure Fires (45.8%), and Outside Fires (29.5%).