Seymour: Fire Incidents, Indiana (IN)
Where are fire incidents reported in Seymour, IN
Something went wrong! Please refresh the page.
| Fire incidents reported | |
|---|---|
| Sreet name | Count |
| TIPTON ST | 250 |
| OAK ST | 106 |
| 2ND ST | 82 |
| BROADWAY ST | 82 |
| STATE ROAD 258 | 82 |
| OBRIEN ST | 62 |
| VINE ST | 52 |
| 4TH ST | 48 |
| WALNUT ST | 46 |
| BROWN ST | 44 |
| 3RD ST | 42 |
| JACKSON PARK DR | 42 |
| CHESTNUT ST | 40 |
| US HWY 31 | 38 |
| EWING ST | 34 |
| LAUREL ST | 34 |
| 4TH ST RD | 32 |
| 6TH ST | 32 |
| STATE ROAD 58 | 32 |
| 100 | 28 |
| A AVE | 28 |
| COUNTY ROAD 100 EAST | 28 |
| 10TH ST | 26 |
| SANDY CREEK DR | 26 |
| BENT TREE LANE | 22 |
| EUCLID AVE | 22 |
| 5TH ST | 20 |
| PARK ST | 20 |
| POPLAR ST | 20 |
| BASE ROAD | 18 |
| Other | 166 |
2002 - 2018 National Fire Incident Reporting System (NFIRS) incidents
- Incident types reported to NFIRS in Seymour, IN
- 2,16638.6%Rescue & EMS
- 1,60428.6%Fire
- 70112.5%Hazardous Condition
- 4908.7%False Alarm
- 3596.4%Service Call
- 2344.2%Good Intent Call
- 320.6%Special Incident
- 190.3%Overpressure Rupture
- 120.2%Severe Weather
- Fire incident types reported to NFIRS in Seymour, IN
- 54634.0%Outside Fires
- 53233.2%Structure Fires
- 28117.5%Mobile Property/Vehicle Fires
- 24515.3%Other
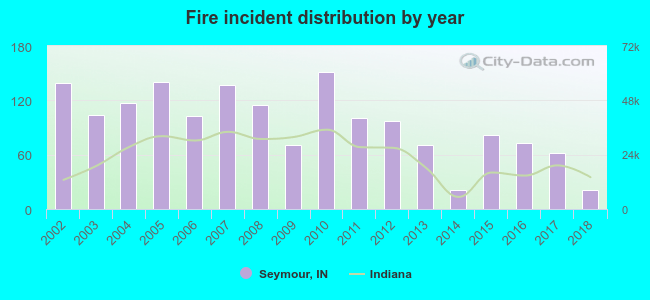 Based on the data from the years 2002 - 2018 the average number of fire incidents per year is 94. The highest number of reported fires - 151 took place in 2010, and the least - 21 in 2014. The data has a dropping trend.
The average number of yearly fire incidents per 10k residents in Seymour, IN compared to nearest cities:
(Note: Based on data for the last 3 years, including only cities with population 5,000 and above)
| Seymour: | 27.2 |
| North Vernon: | 104.0 |
| Columbus: | 37.4 |
| Scottsburg: | 4.0 |
| Salem: | 48.1 |
| Madison: | 35.5 |
| Bedford: | 44.7 |
| Greensburg: | 53.0 |
| Charlestown: | 29.0 |
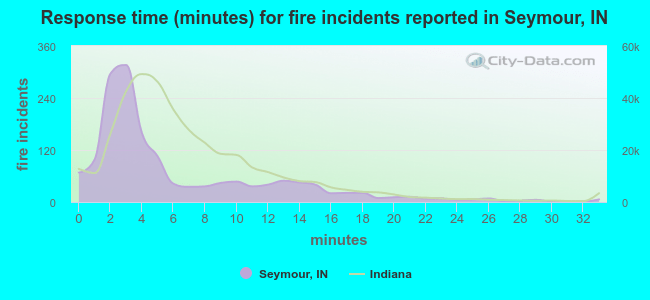 The median response time based on all reported fire incidents is 4 minutes. This is lower compared to the state median value.
The median response time in Seymour, IN compared to nearest cities:
(Note: Based on data for all years, including only cities with at least 500 fire incidents)
| Seymour: | 4 minutes |
| North Vernon: | 9 minutes |
| Columbus: | 7 minutes |
| Scottsburg: | 5 minutes |
| Nashville: | 12 minutes |
| Salem: | 7 minutes |
| Edinburgh: | 7 minutes |
| Madison: | 6 minutes |
| Bedford: | 7 minutes |
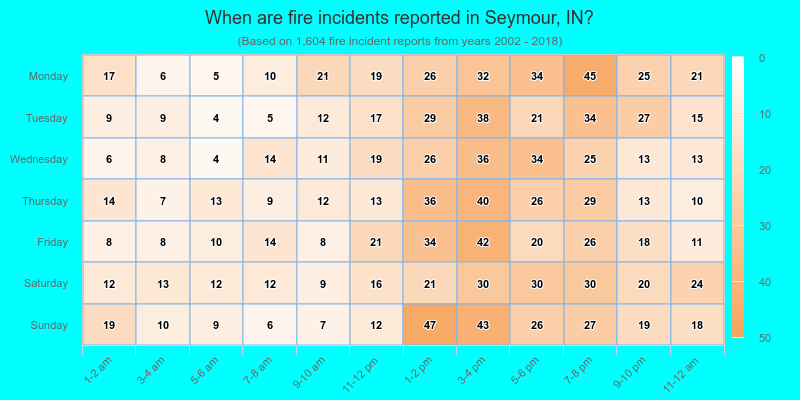
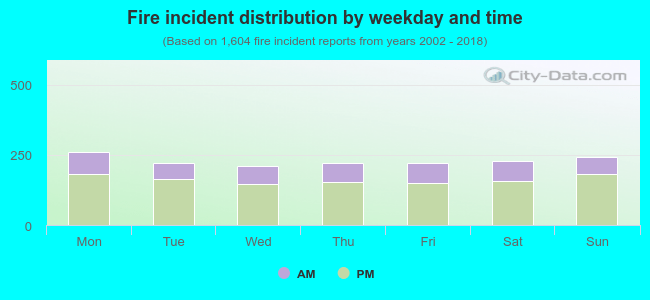 29.3% incidents where reported in the morning and 70.7% in the evening. The most fires (16.3%) took place on Monday, and the least (13.0%) on Wednesday.
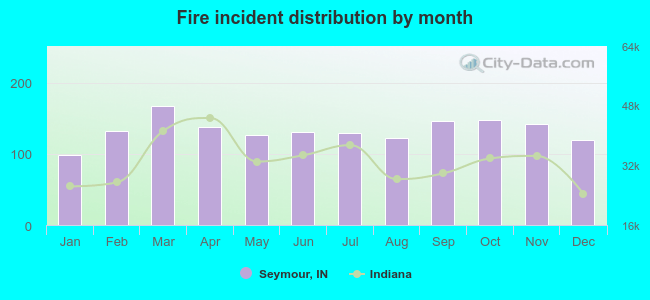 Based on the 1,604 fires from years 2002 - 2018 most fires (10.5%) took place during March, and the least (6.2%) in January.
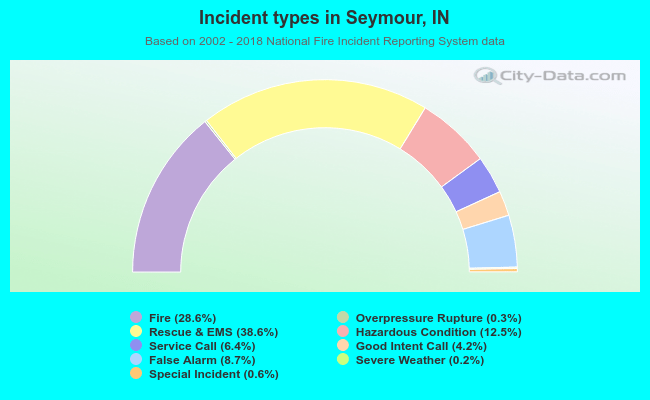 Out of all 5,617 cases reported during the years 2002 - 2018, the most belonged to the categories: Rescue & EMS (38.6%), Fire (28.6%), and Hazardous Condition (12.5%).
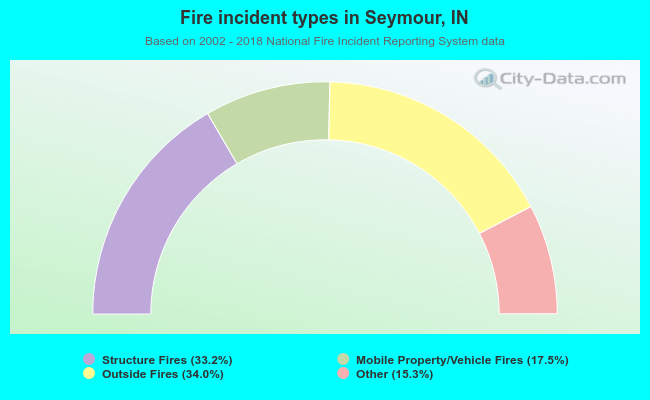 When looking into fire subcategories, the most reports belonged to: Outside Fires (34.0%), and Structure Fires (33.2%).