Malone: Fire Incidents, New York (NY)
Where are fire incidents reported in Malone, NY
Something went wrong! Please refresh the page.
|
| |||||||||||||||||||||||||||||||||||||||||||||||||||||||||||||||||||||||||||||||||||||||||||||||||||||||||||||
| Other | 93 | |||||||||||||||||||||||||||||||||||||||||||||||||||||||||||||||||||||||||||||||||||||||||||||||||||||||||||||
2002 - 2018 National Fire Incident Reporting System (NFIRS) incidents
- Incident types reported to NFIRS in Malone, NY
- 1,50636.0%Rescue & EMS
- 78118.7%Fire
- 75918.1%Hazardous Condition
- 44510.6%Good Intent Call
- 3648.7%False Alarm
- 3077.3%Service Call
- 140.3%Severe Weather
- 50.1%Special Incident
- Fire incident types reported to NFIRS in Malone, NY
- 47460.7%Structure Fires
- 20025.6%Outside Fires
- 8611.0%Mobile Property/Vehicle Fires
- 212.7%Other
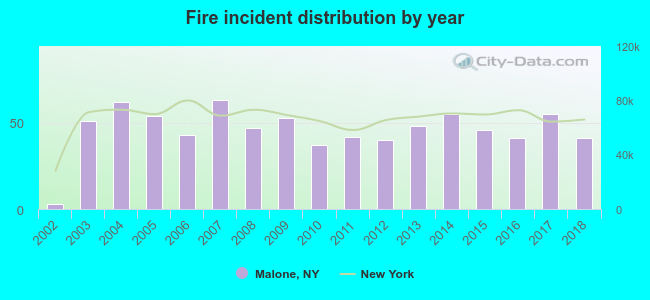 Based on the data from the years 2002 - 2018 the average number of fires per year is 46. The highest number of reported fire incidents - 63 took place in 2007, and the least - 3 in 2002. The data has a rising trend.
The average number of yearly fire incidents per 10k residents in Malone, NY compared to nearest cities:
(Note: Based on data for the last 3 years, including only cities with population 5,000 and above)
| Malone: | 78.4 |
| Massena: | 4.7 |
| Potsdam: | 25.3 |
| Saranac Lake: | 38.2 |
| Schuyler Falls: | 19.3 |
| Beekmantown: | 8.4 |
| North Elba: | 1.1 |
| Plattsburgh: | 62.0 |
| Canton: | 50.5 |
 The median response time based on all reported fire incidents is 9 minutes. This is much higher compared to the state median value.
The median response time in Malone, NY compared to nearest cities:
(Note: Based on data for all years, including only cities with at least 500 fire incidents)
| Malone: | 9 minutes |
| Potsdam: | 4 minutes |
| Plattsburgh: | 6 minutes |
 30.2% incidents where reported in the morning and 69.8% in the evening. The most fires (16.8%) took place on Tuesday, and the least (11.1%) on Wednesday.
 According to the 781 incident reports from years 2002 - 2018 most fires (14.7%) took place during April, and the least (6.1%) in November.
 Out of all 4,183 cases reported during the years 2002 - 2018, the most belonged to the categories: Rescue & EMS (36.0%), Fire (18.7%), and Hazardous Condition (18.1%).
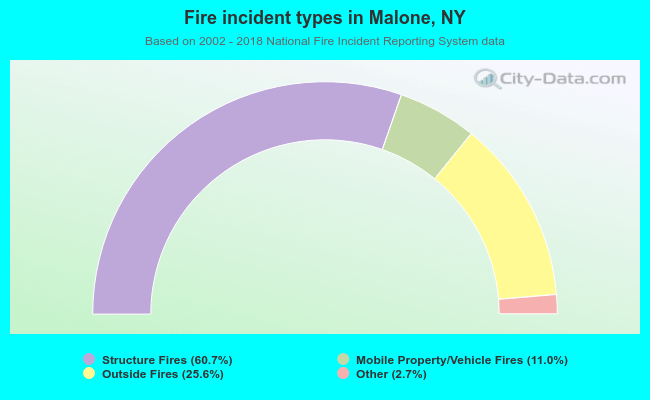 When looking into fire subcategories, the most reports belonged to: Structure Fires (60.7%), and Outside Fires (25.6%).