Manorhaven: Fire Incidents, New York (NY)
Where are fire incidents reported in Manorhaven, NY
Something went wrong! Please refresh the page.
|
| |||||||||||||||||||||||||||||||||||||||||||||||||||||||||||||||||||||||||||||||||||||||||||||||||
2006 - 2018 National Fire Incident Reporting System (NFIRS) incidents
- Incident types reported to NFIRS in Manorhaven, NY
- 33438.3%Rescue & EMS
- 25529.2%Hazardous Condition
- 12214.0%Fire
- 9110.4%False Alarm
- 485.5%Service Call
- 222.5%Good Intent Call
- 10.1%Special Incident
- Fire incident types reported to NFIRS in Manorhaven, NY
- 8771.3%Structure Fires
- 1613.1%Outside Fires
- 108.2%Mobile Property/Vehicle Fires
- 97.4%Other
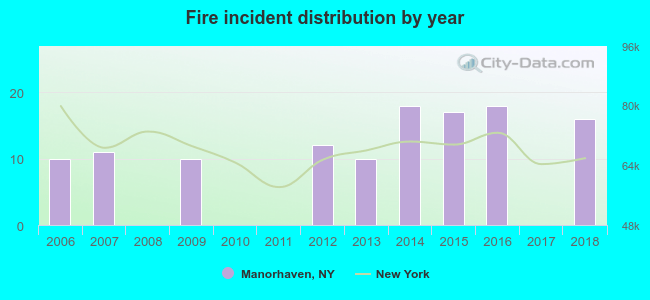 Based on the data from the years 2006 - 2018 the average number of fire incidents per year is 9. The highest number of fire incidents - 18 took place in 2014, and the least - 0 in 2008. The data has an increasing trend.
The average number of yearly fire incidents per 10k residents in Manorhaven, NY compared to nearest cities:
(Note: Based on data for the last 3 years, including only cities with population 5,000 and above)
| Manorhaven: | 25.4 |
| Port Washington: | 38.9 |
| Great Neck: | 27.3 |
| Manhasset: | 1.2 |
| Sea Cliff: | 10.6 |
| Great Neck Plaza: | 2.9 |
| Glen Cove: | 21.1 |
| North Hills: | 1.9 |
| Roslyn Heights: | 6.6 |
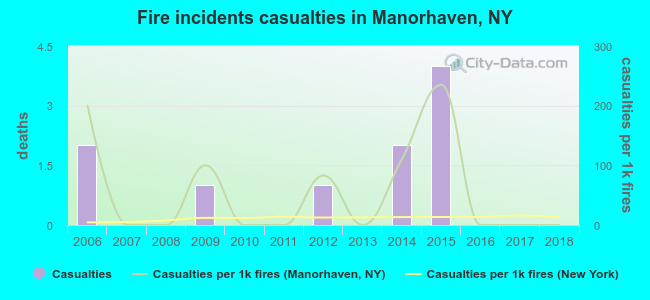 According to the reports from the years 2006 - 2018 the average number of fire-related yearly casualties is 1. The highest number of casualties - 4 took place in 2015, and the lowest - 0 in 2007. The data has a declining trend.
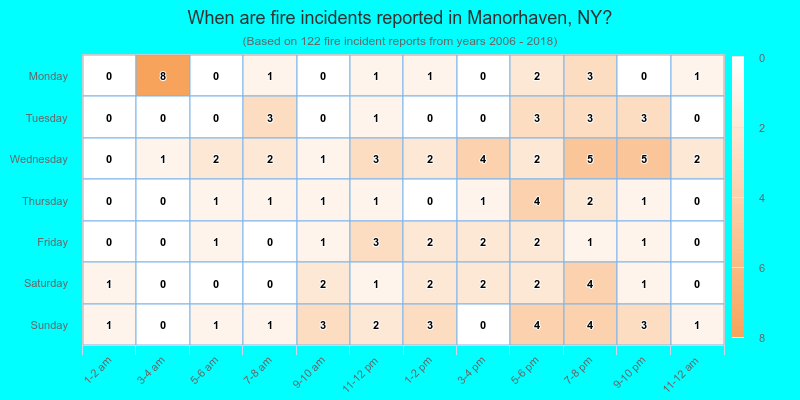
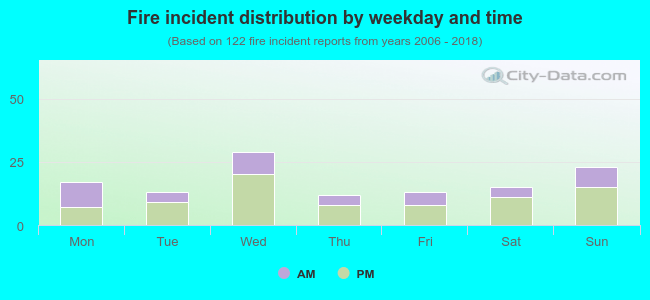 36.1% incidents where reported in the morning and 63.9% in the evening. The most fires (23.8%) took place on Wednesday, and the least (9.8%) on Thursday.
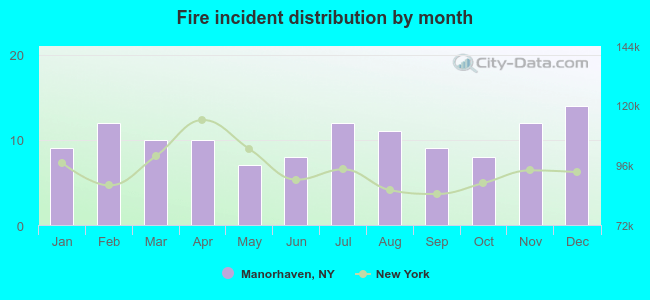 Based on the 122 fires from years 2006 - 2018 most fires (11.5%) took place during December, and the least (5.7%) in May.
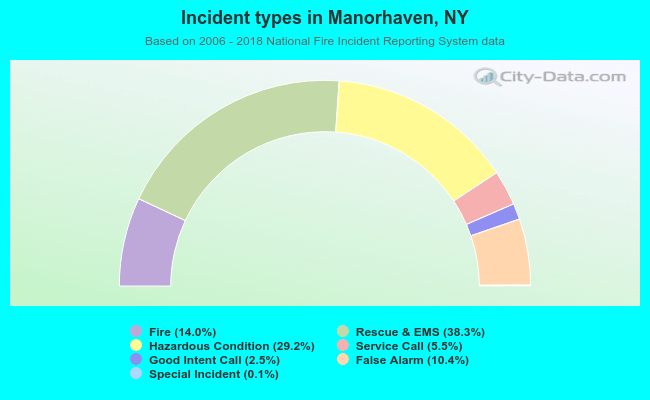 Out of all 873 cases reported during the years 2006 - 2018, the most belonged to the categories: Overpressure Rupture (38.3%), Rescue & EMS (29.2%), and Fire (14.0%).
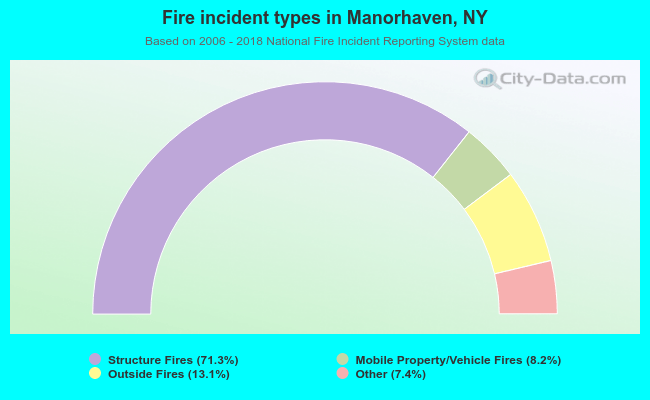 When looking into fire subcategories, the most reports belonged to: Structure Fires (71.3%), and Outside Fires (13.1%).