Glen Cove: Fire Incidents, New York (NY)
Where are fire incidents reported in Glen Cove, NY
Something went wrong! Please refresh the page.
|
| |||||||||||||||||||||||||||||||||||||||||||||||||||||||||||||||||||||||||||||||||||||||||||||||||||||||||||||
2007 - 2018 National Fire Incident Reporting System (NFIRS) incidents
- Incident types reported to NFIRS in Glen Cove, NY
- 1,11129.1%Hazardous Condition
- 95224.9%False Alarm
- 71318.7%Good Intent Call
- 64716.9%Fire
- 2115.5%Service Call
- 1694.4%Rescue & EMS
- 90.2%Severe Weather
- 40.1%Special Incident
- Fire incident types reported to NFIRS in Glen Cove, NY
- 39360.7%Structure Fires
- 13721.2%Outside Fires
- 6810.5%Other
- 497.6%Mobile Property/Vehicle Fires
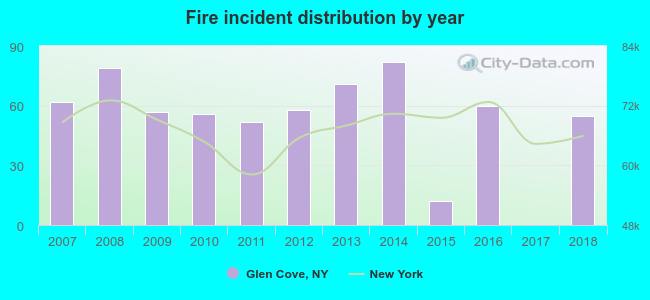 According to the data from the years 2007 - 2018 the average number of fires per year is 54. The highest number of fires - 82 took place in 2014, and the least - 0 in 2017. The data has a dropping trend.
The average number of yearly fire incidents per 10k residents in Glen Cove, NY compared to nearest cities:
(Note: Based on data for the last 3 years, including only cities with population 5,000 and above)
| Glen Cove: | 21.1 |
| Sea Cliff: | 10.6 |
| Port Washington: | 38.9 |
| Bayville: | 22.7 |
| Manorhaven: | 25.4 |
| Oyster Bay: | 13.9 |
| East Hills: | 9.9 |
| Roslyn Heights: | 6.6 |
| Manhasset: | 1.2 |
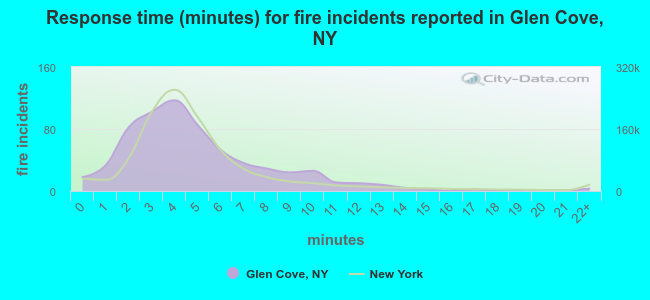 The median response time based on all reported fire incidents is 4 minutes. This is comparable to the New York median value.
The median response time in Glen Cove, NY compared to nearest cities:
(Note: Based on data for all years, including only cities with at least 500 fire incidents)
| Glen Cove: | 4 minutes |
| Port Washington: | 4 minutes |
| Larchmont: | 2 minutes |
| Rye: | 4 minutes |
| Hicksville: | 4 minutes |
| New Rochelle: | 6 minutes |
| Garden City: | 3 minutes |
| New Hyde Park: | 4 minutes |
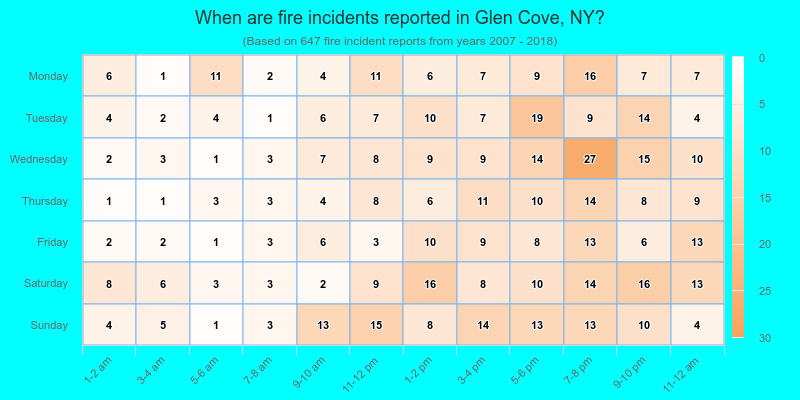
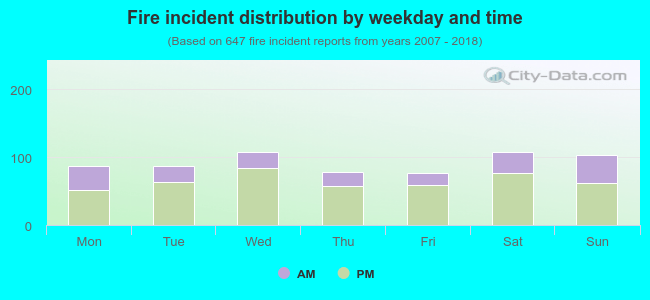 29.7% incidents where reported in the morning and 70.3% in the evening. The most fires (16.7%) took place on Wednesday, and the least (11.7%) on Friday.
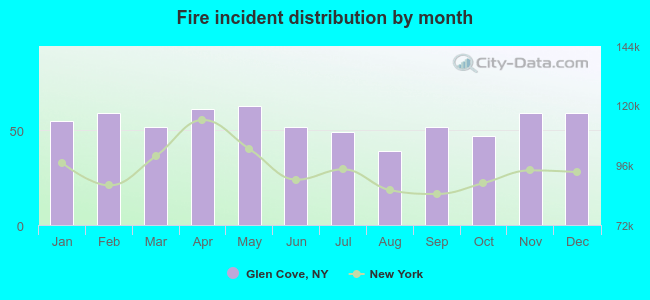 According to the 647 reports from years 2007 - 2018 most fires (9.7%) took place during May, and the least (6.0%) in August.
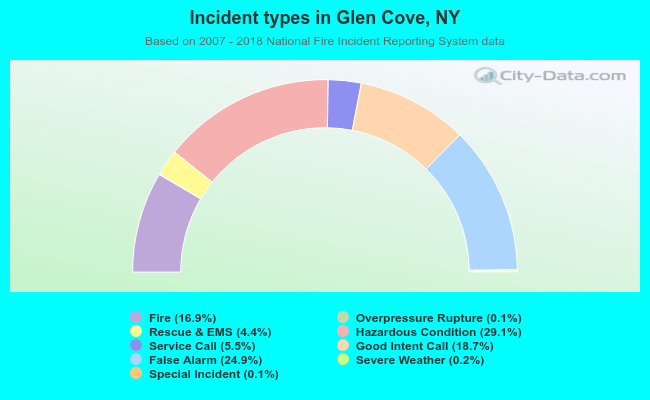 Out of all 3,819 cases reported during the years 2007 - 2018, the most belonged to the categories: Hazardous Condition (29.1%), False Alarm (24.9%), and Good Intent Call (18.7%).
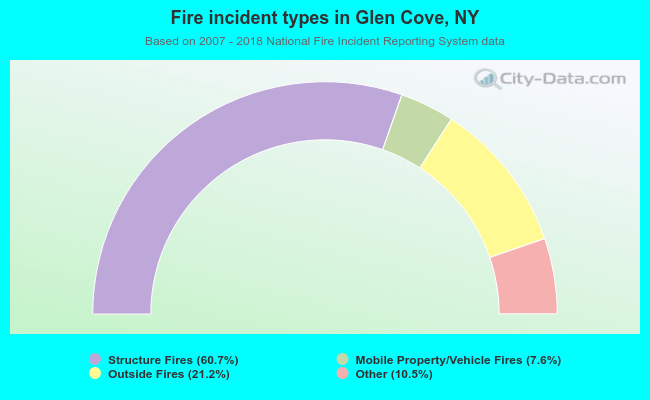 When looking into fire subcategories, the most reports belonged to: Structure Fires (60.7%), and Outside Fires (21.2%).