| Fire incidents reported |
|---|
| Sreet name | Count |
|---|
| LAWRENCE 1230 | 6 | | LAWRENCE 1232 | 6 | | LAWRENCE 1235 | 6 | | OLD HWY 60 | 6 | | 18160 LAWRENCE 1210 | 4 | | 21244 LAW 1240 | 4 | | 23214 HWY 174 | 4 | | 23348 HWY 174 | 4 | | 307 E ODELL | 4 | | 60 AND WESTERN | 4 | | 610 LOGAN | 4 | | 710 FISKE | 4 | | COLLIER | 4 | | HWY 14 | 4 | | LAWRENCE 1225 | 4 | | LAWRENCE 1240 | 4 | | MISSOURI 174 HWY | 4 | | TIMBREN RD | 4 | | 100 MAY | 2 | | 100 S MILL | 2 | | 101 E. ODELL | 2 | | 102 MARTHA | 2 | | 102 MARTHA APT 26 | 2 | | 10380 HWY 0 | 2 | | 104 E WATER | 2 |
| | | Fire incidents reported |
|---|
| Sreet name | Count |
|---|
| 104 MARTHA DR APT 14 | 2 | | 104 NORTH WESTERN | 2 | | 105 N EUCLID | 2 | | 105 N TOUNGBLOOD | 2 | | 106 E MAY | 2 | | 106 ORCHARD | 2 | | 108 E ODELL | 2 | | 108 EAST ODELL | 2 | | 109 E BENTON | 2 | | 109 S. COLLEGE | 2 | | 110 N JEFFERSON | 2 | | 110 N MISSOURI | 2 | | 114 N WESTVIEW | 2 | | 12202170 | 2 | | 1230 2240 | 2 | | 1230 @ 2170 | 2 | | 1235 ( 2 MILES OUT ) | 2 | | 1235 LAWRENCE | 2 | | 1240 NORTH TWO MILES | 2 | | 1240 SOUTH OF 265 12 MILE | 2 | | 1250 AND 2175 | 2 | | 126 ORCHARD | 2 | | 129 ORCHARD | 2 | | 14 AND BENTON | 2 | | 14 AND ZZ | 2 |
|
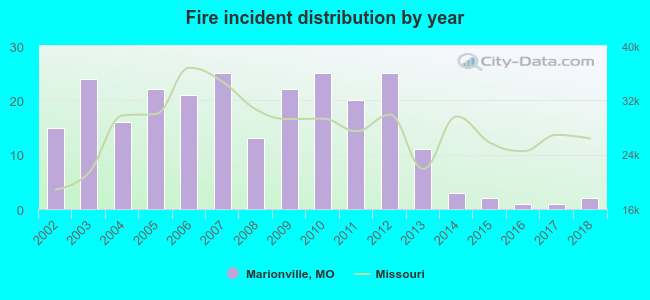 According to the data from the years 2002 - 2018 the average number of fires per year is 15. The highest number of fires - 25 took place in 2007, and the least - 1 in 2016. The data has a decreasing trend.
 27.8% incidents where reported in the morning and 72.2% in the evening. The most fires (17.7%) took place on Thursday, and the least (11.3%) on Tuesday.
 According to the 248 fire incidents from years 2002 - 2018 most fires (11.7%) took place during June, and the least (2.4%) in September.
 Out of all 693 cases reported during the years 2002 - 2018, the most belonged to the categories: Fire (35.8%), Overpressure Rupture (30.7%), and Rescue & EMS (28.3%).
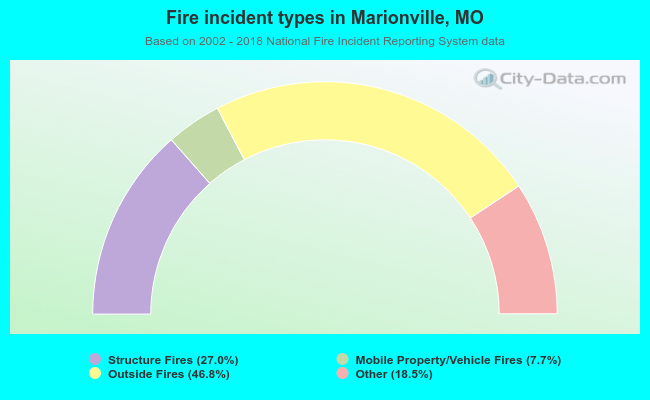 When looking into fire subcategories, the most incidents belonged to: Outside Fires (46.8%), and Structure Fires (27.0%).