Marshall: Fire Incidents, Texas (TX)
Where are fire incidents reported in Marshall, TX
Something went wrong! Please refresh the page.
| Fire incidents reported | |
|---|---|
| Sreet name | Count |
| EAST END BLVD | 300 |
| PINECREST DR | 124 |
| GRAND AVE | 116 |
| VICTORY DR | 102 |
| HWY 59 | 94 |
| HOUSTON ST | 86 |
| RUSK ST | 74 |
| TRAVIS ST | 74 |
| UNIVERSITY AVE | 62 |
| ELYSIAN FIELDS AVE | 58 |
| MARTIN LUTHER KING JR BLVD | 58 |
| WASHINGTON AVE | 58 |
| I20 | 54 |
| POPLAR ST | 54 |
| WARD ST | 52 |
| FRANKLIN ST | 46 |
| SANFORD ST | 44 |
| BURLESON ST | 42 |
| FIVE NOTCH RD | 42 |
| FM 1793 | 42 |
| EVANS ST | 40 |
| I 20 | 40 |
| WARREN DR | 40 |
| HOUSTON AVE | 38 |
| KARNACK HWY | 36 |
| MEREDITH ST | 36 |
| NORWOOD ST | 36 |
| COMMERCE ST | 34 |
| I-20 | 34 |
| GARRETT ST | 32 |
| Other | 1,438 |
2002 - 2018 National Fire Incident Reporting System (NFIRS) incidents
- Incident types reported to NFIRS in Marshall, TX
- 3,38631.7%Fire
- 3,07128.7%Rescue & EMS
- 1,63815.3%Service Call
- 1,17811.0%Hazardous Condition
- 7817.3%Good Intent Call
- 5315.0%False Alarm
- 550.5%Special Incident
- 290.3%Overpressure Rupture
- 140.1%Severe Weather
- Fire incident types reported to NFIRS in Marshall, TX
- 1,61447.7%Outside Fires
- 1,07031.6%Structure Fires
- 59917.7%Mobile Property/Vehicle Fires
- 1033.0%Other
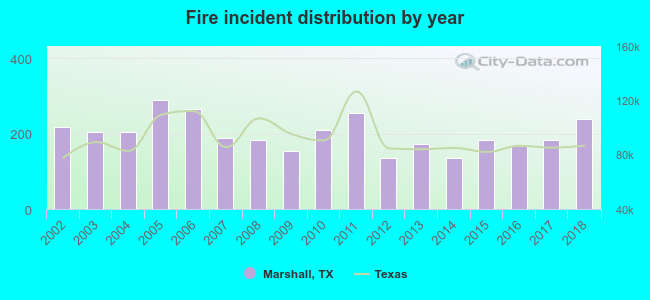 According to the data from the years 2002 - 2018 the average number of fires per year is 199. The highest number of reported fire incidents - 288 took place in 2005, and the least - 134 in 2014. The data has a rising trend.
The average number of yearly fire incidents per 10k residents in Marshall, TX compared to nearest cities:
(Note: Based on data for the last 3 years, including only cities with population 5,000 and above)
| Marshall: | 79.8 |
| Harleton: | 1.6 |
| Longview: | 57.1 |
| Carthage: | 64.5 |
| White Oak: | 55.9 |
| Kilgore: | 113.1 |
| Gladewater: | 86.0 |
| Gilmer: | 449.8 |
| Henderson: | 177.9 |
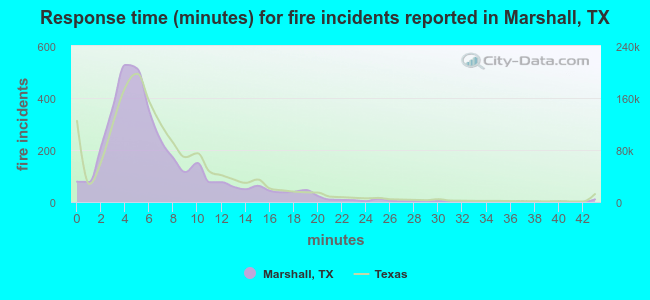 The median response time based on all reported fire incidents is 5 minutes. This is lower than the state median value.
The median response time in Marshall, TX compared to nearest cities:
(Note: Based on data for all years, including only cities with at least 500 fire incidents)
| Marshall: | 5 minutes |
| Hallsville: | 9 minutes |
| Waskom: | 8 minutes |
| Longview: | 6 minutes |
| Carthage: | 6 minutes |
| White Oak: | 6 minutes |
| Kilgore: | 8 minutes |
| Vivian: | 6 minutes |
| Gladewater: | 7 minutes |
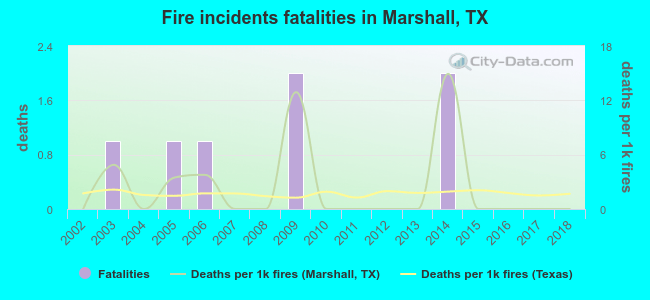 Based on the reports from the years 2002 - 2018 the average number of fire-related yearly deaths is 0. The highest number of deaths - 2 took place in 2009, and the lowest - 0 in 2002. The data has a constant trend.
The average number of fatalities per 1,000 fire incidents is 2. This indicator was the highest - 15 in 2014, and the lowest 0 in 2002. The trend for deaths per 1,000 fire incidents is constant. Compared to the state value the number of fatalities per 1,000 fires is higher.
Based on the reports from the years 2002 - 2018 the average number of fire-related yearly deaths is 0. The highest number of deaths - 2 took place in 2009, and the lowest - 0 in 2002. The data has a constant trend.
The average number of fatalities per 1,000 fire incidents is 2. This indicator was the highest - 15 in 2014, and the lowest 0 in 2002. The trend for deaths per 1,000 fire incidents is constant. Compared to the state value the number of fatalities per 1,000 fires is higher.Deaths per 1,000 incidents in Marshall, TX compared to nearest cities:
(Note: Based on data for all years, including only cities with at least 2,500 fire incidents)
| Marshall: | 2.1 |
| Longview: | 2.8 |
| Kilgore: | 5.1 |
| Shreveport: | 1.6 |
| Gilmer: | 0.8 |
| Henderson: | 1.0 |
| Bossier City: | 1.0 |
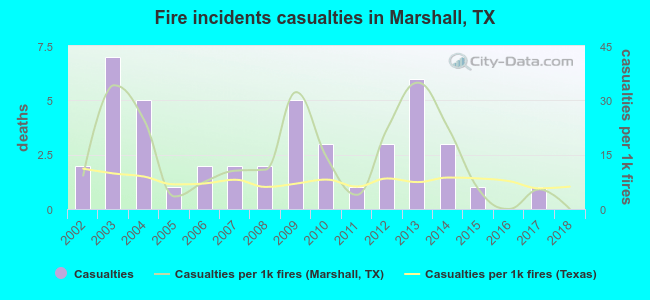 Based on the data from the years 2002 - 2018 the average number of fire-related yearly casualties is 3. The highest number of casualties - 7 took place in 2003, and the lowest - 0 in 2016. The data has a declining trend.
The average number of casualties per 1,000 fires is 14. This indicator was the highest - 35 in 2013, and the lowest 0 in 2016. The trend for injuries per 1,000 fire incidents is dropping. Compared to the Texas value the number of casualties per 1,000 fire incidents is higher.
Based on the data from the years 2002 - 2018 the average number of fire-related yearly casualties is 3. The highest number of casualties - 7 took place in 2003, and the lowest - 0 in 2016. The data has a declining trend.
The average number of casualties per 1,000 fires is 14. This indicator was the highest - 35 in 2013, and the lowest 0 in 2016. The trend for injuries per 1,000 fire incidents is dropping. Compared to the Texas value the number of casualties per 1,000 fire incidents is higher.Casualties per 1,000 incidents in Marshall, TX compared to nearest cities:
(Note: Based on data for all years, including only cities with at least 500 fire incidents)
| Marshall: | 13.0 |
| Hallsville: | 3.8 |
| Waskom: | 0.0 |
| Longview: | 17.1 |
| Carthage: | 10.2 |
| White Oak: | 3.1 |
| Kilgore: | 7.8 |
| Vivian: | 0.0 |
| Gladewater: | 8.7 |
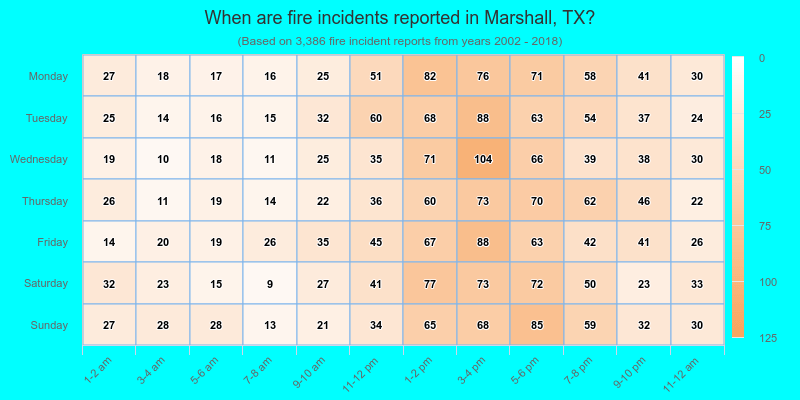
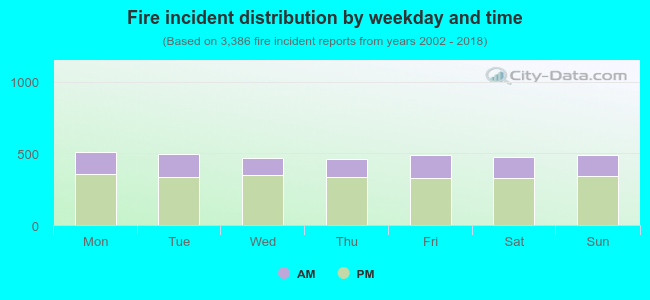 30.1% incidents where reported in the morning and 69.9% in the evening. The most fires (15.1%) took place on Monday, and the least (13.6%) on Thursday.
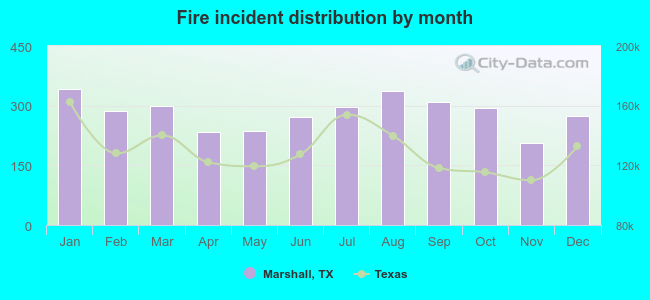 Based on the 3,386 reports from years 2002 - 2018 most fires (10.1%) took place during January, and the least (6.1%) in November.
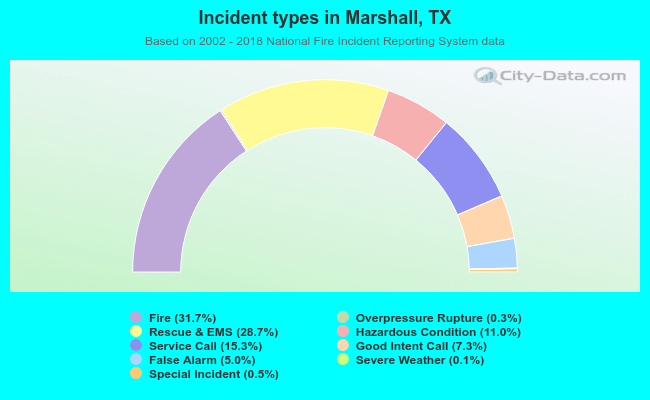 Out of all 10,683 cases reported during the years 2002 - 2018, the most belonged to the categories: Fire (31.7%), Rescue & EMS (28.7%), and Service Call (15.3%).
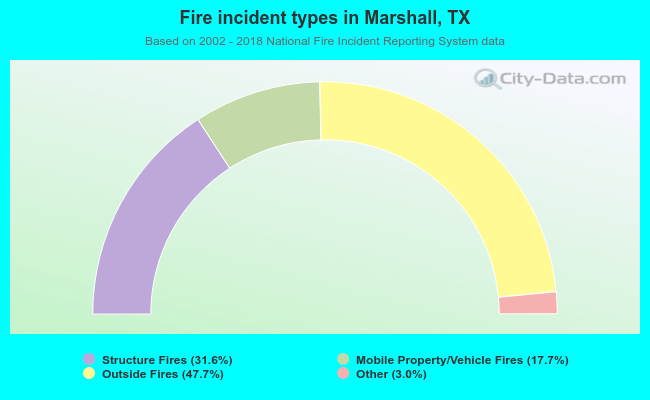 When looking into fire subcategories, the most incidents belonged to: Outside Fires (47.7%), and Structure Fires (31.6%).