Vivian: Fire Incidents, Louisiana (LA)
Where are fire incidents reported in Vivian, LA
Something went wrong! Please refresh the page.
|
| |||||||||||||||||||||||||||||||||||||||||||||||||||||||||||||||||||||||||||||||||||||||||||||||||||||||||||||
2002 - 2018 National Fire Incident Reporting System (NFIRS) incidents
- Incident types reported to NFIRS in Vivian, LA
- 2,86362.6%Rescue & EMS
- 70115.3%Fire
- 3537.7%Good Intent Call
- 3126.8%Service Call
- 2234.9%Hazardous Condition
- 1142.5%False Alarm
- Fire incident types reported to NFIRS in Vivian, LA
- 37253.1%Outside Fires
- 25135.8%Structure Fires
- 699.8%Mobile Property/Vehicle Fires
- 91.3%Other
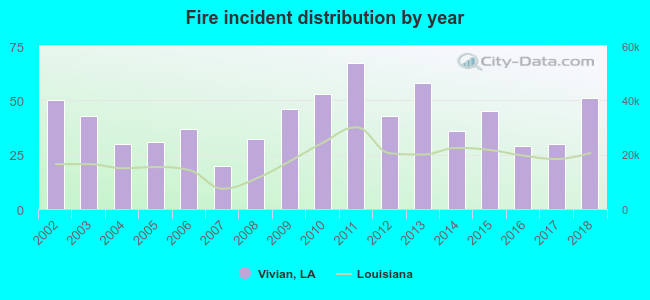 According to the data from the years 2002 - 2018 the average number of fires per year is 41. The highest number of fires - 67 took place in 2011, and the least - 20 in 2007. The data has a growing trend.
 The median response time based on all reported fire incidents is 6 minutes. This is similar to the Louisiana median value.
The median response time in Vivian, LA compared to nearest cities:
(Note: Based on data for all years, including only cities with at least 500 fire incidents)
| Vivian: | 6 minutes |
| Plain Dealing: | 9 minutes |
| Benton: | 7 minutes |
| Fouke: | 10 minutes |
| Bossier City: | 4 minutes |
| Shreveport: | 5 minutes |
| Springhill: | 5 minutes |
| Haughton: | 6 minutes |
| Texarkana: | 5 minutes |
 28.2% incidents where reported in the morning and 71.8% in the evening. The most fires (17.8%) took place on Saturday, and the least (11.1%) on Thursday.
 According to the 701 fire incident reports from years 2002 - 2018 most fires (11.8%) took place during July, and the least (4.4%) in June.
 Out of all 4,571 cases reported during the years 2002 - 2018, the most belonged to the categories: Rescue & EMS (62.6%), Fire (15.3%), and Good Intent Call (7.7%).
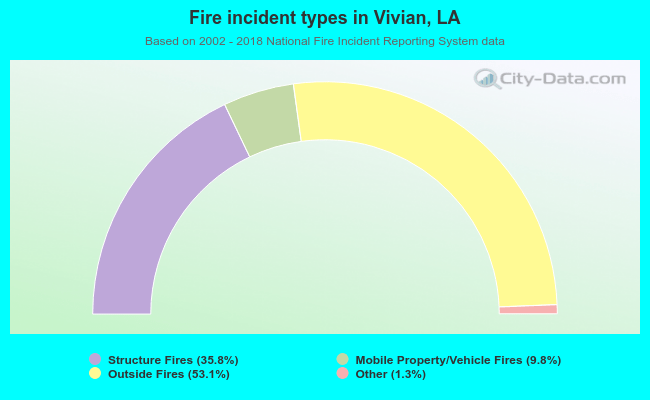 When looking into fire subcategories, the most incidents belonged to: Outside Fires (53.1%), and Structure Fires (35.8%).