Martinsville: Fire Incidents, Virginia (VA)
Where are fire incidents reported in Martinsville, VA
Something went wrong! Please refresh the page.
| Fire incidents reported | |
|---|---|
| Sreet name | Count |
| CHURCH ST | 194 |
| COMMONWEALTH BLVD | 106 |
| FAYETTE ST | 86 |
| MEMORIAL BLVD | 82 |
| STULTZ RD | 80 |
| CHATHAM RD | 64 |
| STARLING AVE | 64 |
| SNOW CREEK RD | 62 |
| SPRUCE ST | 56 |
| CARVER RD | 50 |
| MULBERRY RD | 50 |
| CLEARVIEW DR | 36 |
| RIVES RD | 36 |
| BROOKDALE ST | 34 |
| FOREST ST | 34 |
| MOSS ST | 34 |
| A L PHILPOTT HWY | 32 |
| ASKIN ST | 32 |
| HOLT ST | 32 |
| PARK ST | 32 |
| SMITH ST | 32 |
| ARMSTEAD AVE | 30 |
| CLIFT ST | 30 |
| COMMONWEALTH BLVD. | 30 |
| LIBERTY ST | 30 |
| PRESTON RD | 30 |
| BROAD ST | 28 |
| CARVER ROAD | 24 |
| COMMONWEALTH BLVD | 24 |
| GRAVES ST | 24 |
| Other | 1,853 |
2002 - 2018 National Fire Incident Reporting System (NFIRS) incidents
- Incident types reported to NFIRS in Martinsville, VA
- 12,60061.4%Rescue & EMS
- 3,33116.2%Fire
- 1,6468.0%Hazardous Condition
- 1,3076.4%Good Intent Call
- 9924.8%False Alarm
- 5582.7%Service Call
- 410.2%Severe Weather
- 280.1%Overpressure Rupture
- 260.1%Special Incident
- Fire incident types reported to NFIRS in Martinsville, VA
- 1,41242.4%Structure Fires
- 1,26237.9%Outside Fires
- 46814.0%Mobile Property/Vehicle Fires
- 1895.7%Other
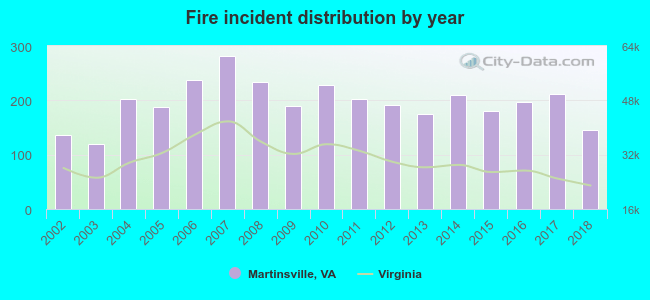 Based on the data from the years 2002 - 2018 the average number of fires per year is 196. The highest number of fire incidents - 282 took place in 2007, and the least - 120 in 2003. The data has a rising trend.
The average number of yearly fire incidents per 10k residents in Martinsville, VA compared to nearest cities:
(Note: Based on data for the last 3 years, including only cities with population 5,000 and above)
| Martinsville: | 134.4 |
| Collinsville: | 35.0 |
| Danville: | 62.9 |
| Vinton: | 79.9 |
| Roanoke: | 50.6 |
| Salem: | 28.3 |
| Christiansburg: | 55.5 |
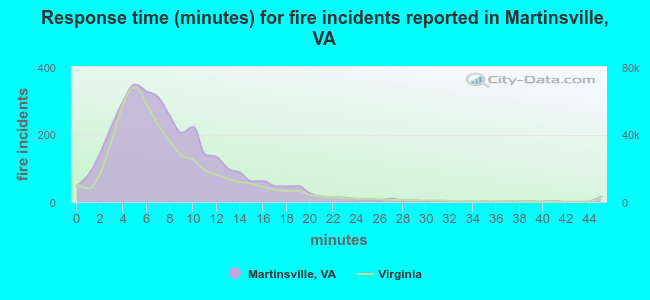 The median response time based on all reported fire incidents is 7 minutes. This is close to the state median value.
The median response time in Martinsville, VA compared to nearest cities:
(Note: Based on data for all years, including only cities with at least 500 fire incidents)
| Martinsville: | 7 minutes |
| Collinsville: | 8 minutes |
| Ridgeway: | 8 minutes |
| Bassett: | 10 minutes |
| Eden: | 4 minutes |
| Stoneville: | 7 minutes |
| Madison: | 7 minutes |
| Rocky Mount: | 10 minutes |
| Stuart: | 13 minutes |
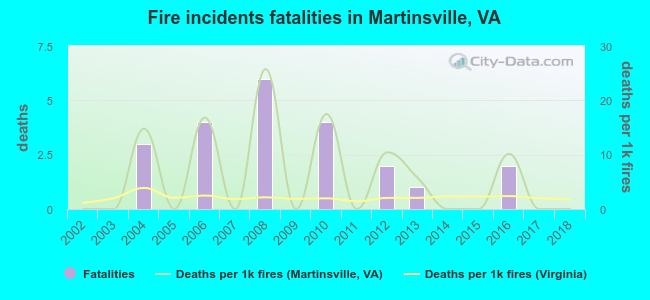 According to the reports from the years 2002 - 2018 the average number of fire-related fatalities per year is 1. The highest number of deaths - 6 took place in 2008, and the lowest - 0 in 2002. The data has a constant trend.
The average number of deaths per 1,000 fire incidents is 6. This indicator was the highest - 26 in 2008, and the lowest 0 in 2002. The trend for fatalities per 1,000 fire incidents is increasing. Compared to the state value the number of deaths per 1,000 fires is much higher.
According to the reports from the years 2002 - 2018 the average number of fire-related fatalities per year is 1. The highest number of deaths - 6 took place in 2008, and the lowest - 0 in 2002. The data has a constant trend.
The average number of deaths per 1,000 fire incidents is 6. This indicator was the highest - 26 in 2008, and the lowest 0 in 2002. The trend for fatalities per 1,000 fire incidents is increasing. Compared to the state value the number of deaths per 1,000 fires is much higher.Deaths per 1,000 incidents in Martinsville, VA compared to nearest cities:
(Note: Based on data for all years, including only cities with at least 2,500 fire incidents)
| Martinsville: | 6.6 |
| Reidsville: | 2.9 |
| Danville: | 3.7 |
| Roanoke: | 3.2 |
| Kernersville: | 1.1 |
| Greensboro: | 1.9 |
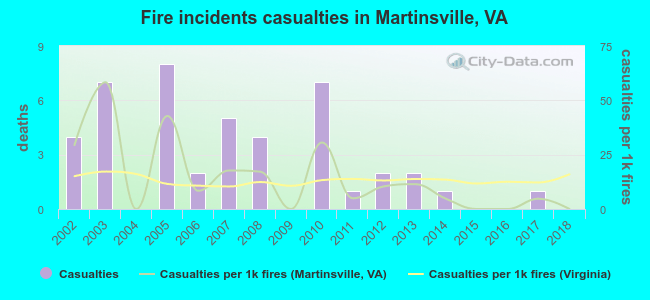 According to the data from the years 2002 - 2018 the average number of fire-related casualties per year is 3. The highest number of reported injuries - 8 took place in 2005, and the lowest - 0 in 2004. The data has a declining trend.
The average number of casualties per 1,000 fire incidents is 14. This indicator was the highest - 58 in 2003, and the lowest 0 in 2004. The trend for injuries per 1,000 fires is dropping. Compared to the state value the number of injuries per 1,000 incidents is similar.
According to the data from the years 2002 - 2018 the average number of fire-related casualties per year is 3. The highest number of reported injuries - 8 took place in 2005, and the lowest - 0 in 2004. The data has a declining trend.
The average number of casualties per 1,000 fire incidents is 14. This indicator was the highest - 58 in 2003, and the lowest 0 in 2004. The trend for injuries per 1,000 fires is dropping. Compared to the state value the number of injuries per 1,000 incidents is similar.Casualties per 1,000 incidents in Martinsville, VA compared to nearest cities:
(Note: Based on data for all years, including only cities with at least 500 fire incidents)
| Martinsville: | 13.2 |
| Collinsville: | 3.7 |
| Ridgeway: | 2.2 |
| Bassett: | 5.2 |
| Eden: | 7.5 |
| Stoneville: | 0.0 |
| Madison: | 4.7 |
| Rocky Mount: | 1.2 |
| Stuart: | 1.0 |
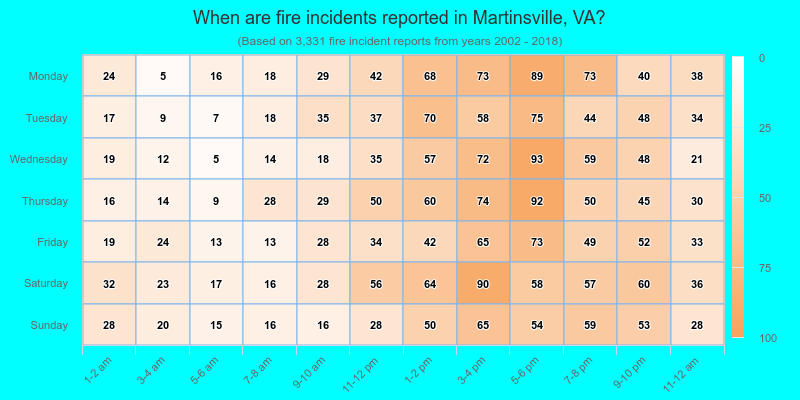
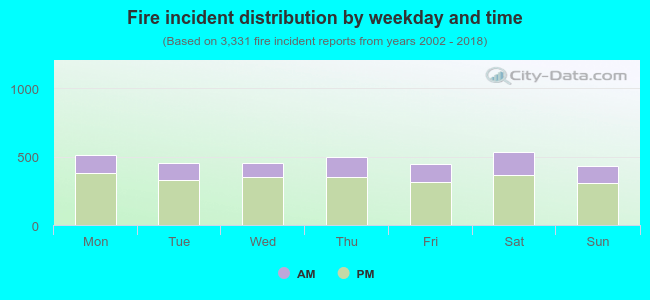 28.0% incidents where reported in the morning and 72.0% in the evening. The most fires (16.1%) took place on Saturday, and the least (13.0%) on Sunday.
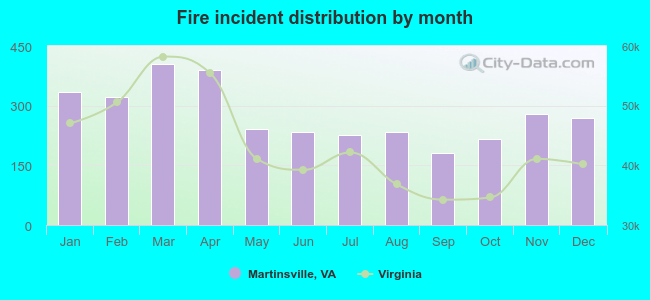 According to the 3,331 fire incidents from years 2002 - 2018 most fires (12.1%) took place during March, and the least (5.4%) in September.
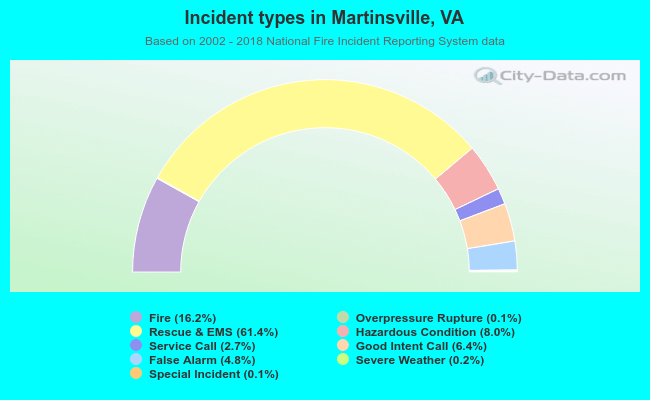 Out of all 20,529 cases reported during the years 2002 - 2018, the most belonged to the categories: Rescue & EMS (61.4%), Fire (16.2%), and Hazardous Condition (8.0%).
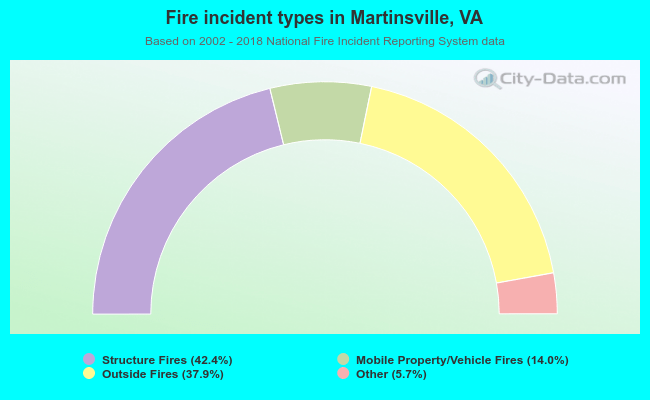 When looking into fire subcategories, the most reports belonged to: Structure Fires (42.4%), and Outside Fires (37.9%).