Reidsville: Fire Incidents, North Carolina (NC)
Where are fire incidents reported in Reidsville, NC
Something went wrong! Please refresh the page.
| Fire incidents reported | |
|---|---|
| Sreet name | Count |
| SCALES ST | 170 |
| FREEWAY DR | 110 |
| US 158 HWY | 104 |
| GROOMS RD | 100 |
| NC 14 HWY | 96 |
| NC 87 SOUTH HWY | 94 |
| BARNES ST | 84 |
| IRON WORKS RD | 78 |
| WENTWORTH ST | 78 |
| VANCE ST | 66 |
| US 29 BUSINESS HWY | 60 |
| WATLINGTON INDUSTRIAL DR | 60 |
| NC 65 HWY | 54 |
| NC 87 HWY | 54 |
| LAWSONVILLE AVE | 50 |
| LINDSEY ST | 46 |
| NARROW GAUGE RD | 44 |
| HARRISON ST | 42 |
| NC 65 | 42 |
| US 29 BYPASS HWY | 42 |
| FRIENDSHIP CHURCH RD | 40 |
| HAMLET RD | 40 |
| MAIN ST | 40 |
| SANDY CROSSROAD RD | 40 |
| US 29 BUS | 40 |
| BROOKS RD | 38 |
| MARKET ST | 38 |
| US 29 BUS HWY | 38 |
| WOLF ISLAND RD | 38 |
| MARCELLUS ST | 36 |
| Other | 1,590 |
2002 - 2018 National Fire Incident Reporting System (NFIRS) incidents
- Incident types reported to NFIRS in Reidsville, NC
- 11,92852.3%Rescue & EMS
- 3,45215.1%Fire
- 2,1589.5%Hazardous Condition
- 1,9278.4%Service Call
- 1,7587.7%Good Intent Call
- 1,0164.5%False Alarm
- 4602.0%Special Incident
- 970.4%Severe Weather
- 260.1%Overpressure Rupture
- Fire incident types reported to NFIRS in Reidsville, NC
- 1,58645.9%Structure Fires
- 1,21135.1%Outside Fires
- 54315.7%Mobile Property/Vehicle Fires
- 1123.2%Other
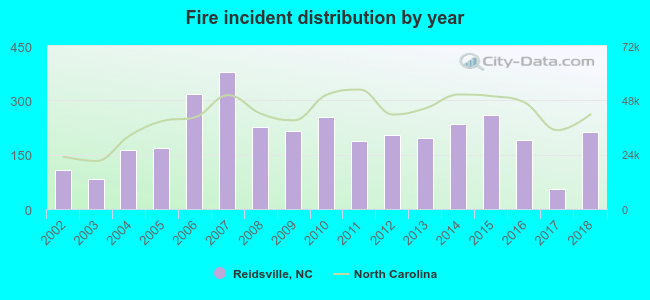 Based on the data from the years 2002 - 2018 the average number of fires per year is 203. The highest number of reported fires - 377 took place in 2007, and the least - 54 in 2017. The data has an increasing trend.
The average number of yearly fire incidents per 10k residents in Reidsville, NC compared to nearest cities:
(Note: Based on data for the last 3 years, including only cities with population 5,000 and above)
| Reidsville: | 108.2 |
| Eden: | 80.3 |
| Summerfield: | 41.2 |
| Gibsonville: | 135.9 |
| Stokesdale: | 65.5 |
| Elon: | 49.2 |
| Greensboro: | 33.0 |
| Oak Ridge: | 30.8 |
| Burlington: | 55.4 |
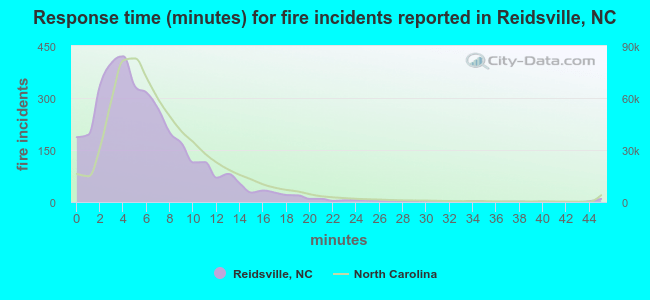 The median response time based on all reported fire incidents is 5 minutes. This is lower than the North Carolina median value.
The median response time in Reidsville, NC compared to nearest cities:
(Note: Based on data for all years, including only cities with at least 500 fire incidents)
| Reidsville: | 5 minutes |
| Eden: | 4 minutes |
| Stoneville: | 7 minutes |
| Summerfield: | 6 minutes |
| Madison: | 7 minutes |
| McLeansville: | 6 minutes |
| Gibsonville: | 5 minutes |
| Stokesdale: | 7 minutes |
| Elon: | 6 minutes |
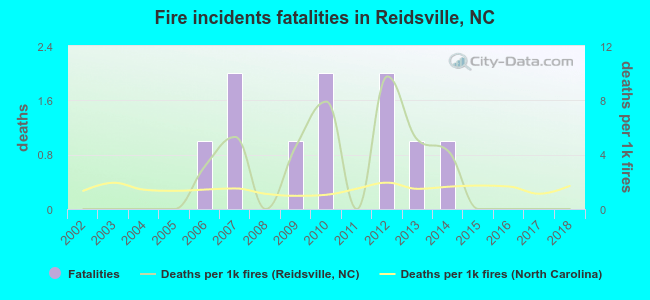 Based on the data from the years 2002 - 2018 the average number of fire-related yearly deaths is 1. The highest number of deaths - 2 took place in 2007, and the lowest - 0 in 2002. The data has a constant trend.
The average number of deaths per 1,000 fires is 2. This indicator was the highest - 10 in 2012, and the lowest 0 in 2002. The trend for fatalities per 1,000 incidents is constant. Compared to the state value the number of deaths per 1,000 fire incidents is higher.
Based on the data from the years 2002 - 2018 the average number of fire-related yearly deaths is 1. The highest number of deaths - 2 took place in 2007, and the lowest - 0 in 2002. The data has a constant trend.
The average number of deaths per 1,000 fires is 2. This indicator was the highest - 10 in 2012, and the lowest 0 in 2002. The trend for fatalities per 1,000 incidents is constant. Compared to the state value the number of deaths per 1,000 fire incidents is higher.Deaths per 1,000 incidents in Reidsville, NC compared to nearest cities:
(Note: Based on data for all years, including only cities with at least 2,500 fire incidents)
| Reidsville: | 2.9 |
| Greensboro: | 1.9 |
| Burlington: | 2.0 |
| Kernersville: | 1.1 |
| High Point: | 1.2 |
| Winston-Salem: | 2.1 |
| Thomasville: | 2.5 |
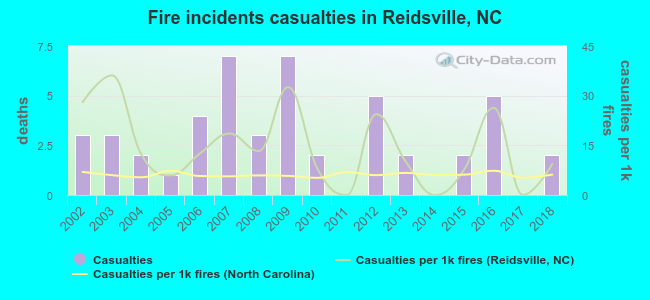 Based on the reports from the years 2002 - 2018 the average number of fire-related casualties per year is 3. The highest number of injuries - 7 took place in 2007, and the lowest - 0 in 2011. The data has a decreasing trend.
The average number of injuries per 1,000 fires is 14. This indicator was the highest - 36 in 2003, and the lowest 0 in 2011. The trend for injuries per 1,000 incidents is declining. Compared to the North Carolina value the number of injuries per 1,000 fire incidents is much higher.
Based on the reports from the years 2002 - 2018 the average number of fire-related casualties per year is 3. The highest number of injuries - 7 took place in 2007, and the lowest - 0 in 2011. The data has a decreasing trend.
The average number of injuries per 1,000 fires is 14. This indicator was the highest - 36 in 2003, and the lowest 0 in 2011. The trend for injuries per 1,000 incidents is declining. Compared to the North Carolina value the number of injuries per 1,000 fire incidents is much higher.Casualties per 1,000 incidents in Reidsville, NC compared to nearest cities:
(Note: Based on data for all years, including only cities with at least 500 fire incidents)
| Reidsville: | 13.9 |
| Eden: | 7.5 |
| Stoneville: | 0.0 |
| Summerfield: | 7.3 |
| Madison: | 4.7 |
| McLeansville: | 2.3 |
| Gibsonville: | 2.7 |
| Stokesdale: | 5.8 |
| Elon: | 12.8 |
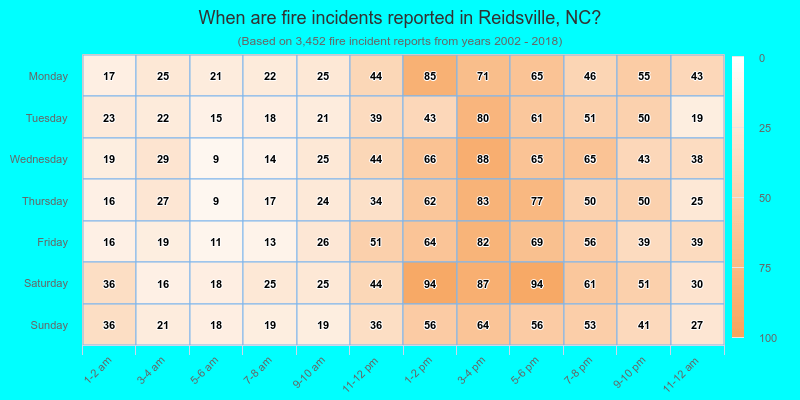
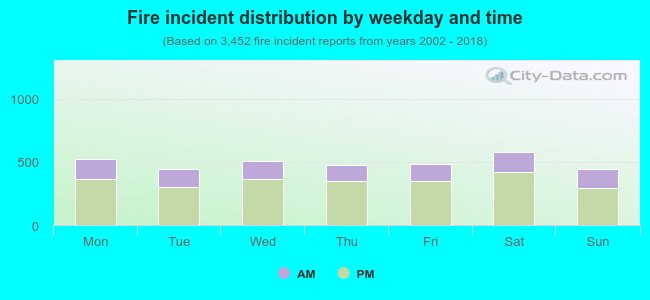 29.2% incidents where reported in the morning and 70.8% in the evening. The most fires (16.8%) took place on Saturday, and the least (12.8%) on Tuesday.
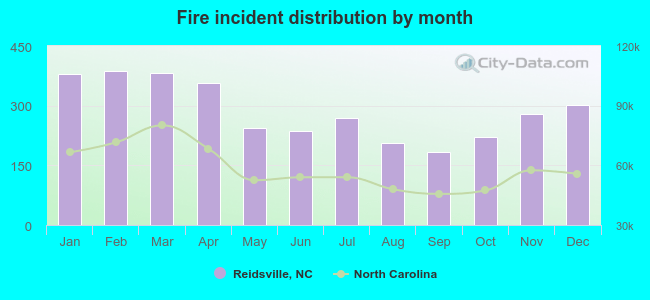 According to the 3,452 fire incidents from years 2002 - 2018 most fires (11.2%) took place during February, and the least (5.3%) in September.
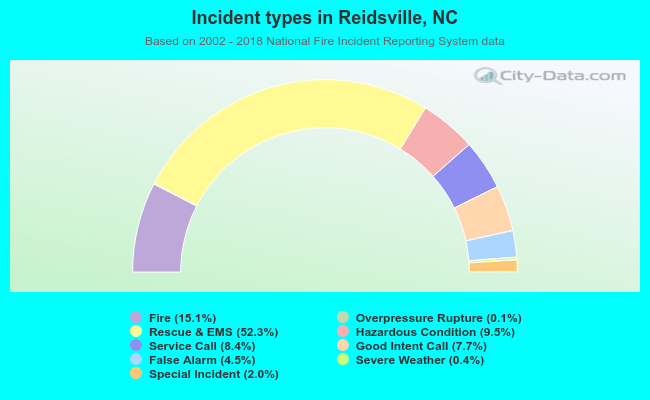 Out of all 22,822 cases reported during the years 2002 - 2018, the most belonged to the categories: Rescue & EMS (52.3%), Fire (15.1%), and Hazardous Condition (9.5%).
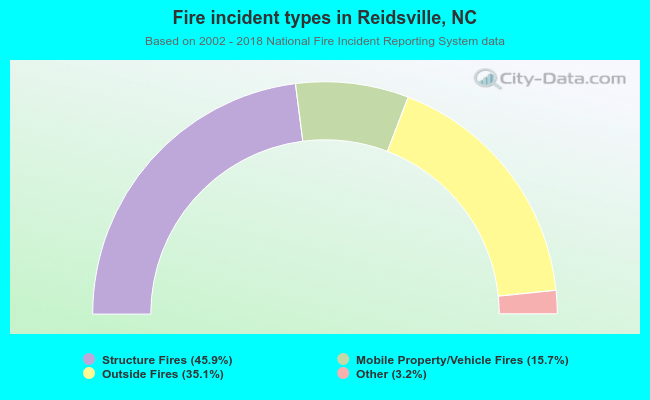 When looking into fire subcategories, the most incidents belonged to: Structure Fires (45.9%), and Outside Fires (35.1%).