Amityville: Fire Incidents, New York (NY)
Where are fire incidents reported in Amityville, NY
Something went wrong! Please refresh the page.
|
| |||||||||||||||||||||||||||||||||||||||||||||||||||||||||||||||||||||||||||||||||||||||||||||||||||||||||||||
| Other | 211 | |||||||||||||||||||||||||||||||||||||||||||||||||||||||||||||||||||||||||||||||||||||||||||||||||||||||||||||
2003 - 2018 National Fire Incident Reporting System (NFIRS) incidents
- Incident types reported to NFIRS in Amityville, NY
- 7,00466.2%Rescue & EMS
- 1,12710.6%Hazardous Condition
- 9759.2%Fire
- 7557.1%False Alarm
- 5485.2%Good Intent Call
- 1521.4%Service Call
- 120.1%Overpressure Rupture
- Fire incident types reported to NFIRS in Amityville, NY
- 66768.4%Structure Fires
- 17317.7%Outside Fires
- 10310.6%Mobile Property/Vehicle Fires
- 323.3%Other
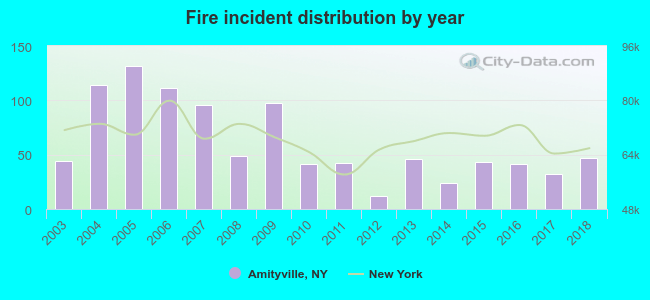 Based on the data from the years 2003 - 2018 the average number of fire incidents per year is 61. The highest number of reported fires - 132 took place in 2005, and the least - 12 in 2012. The data has an increasing trend.
The average number of yearly fire incidents per 10k residents in Amityville, NY compared to nearest cities:
(Note: Based on data for the last 3 years, including only cities with population 5,000 and above)
| Amityville: | 42.0 |
| East Massapequa: | 1.6 |
| Copiague: | 5.7 |
| North Amityville: | 1.5 |
| Massapequa Park: | 17.4 |
| Lindenhurst: | 37.9 |
| Massapequa: | 22.9 |
| South Farmingdale: | 6.7 |
| North Massapequa: | 2.1 |
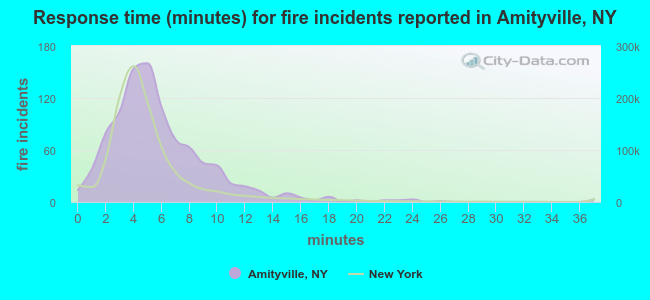 The median response time based on all reported fire incidents is 5 minutes. This is higher than the New York median value.
The median response time in Amityville, NY compared to nearest cities:
(Note: Based on data for all years, including only cities with at least 500 fire incidents)
| Amityville: | 5 minutes |
| Copiague: | 4 minutes |
| Lindenhurst: | 3 minutes |
| Massapequa: | 6 minutes |
| Wyandanch: | 3 minutes |
| Levittown: | 3 minutes |
| West Islip: | 3 minutes |
| Hicksville: | 4 minutes |
| Freeport: | 3 minutes |
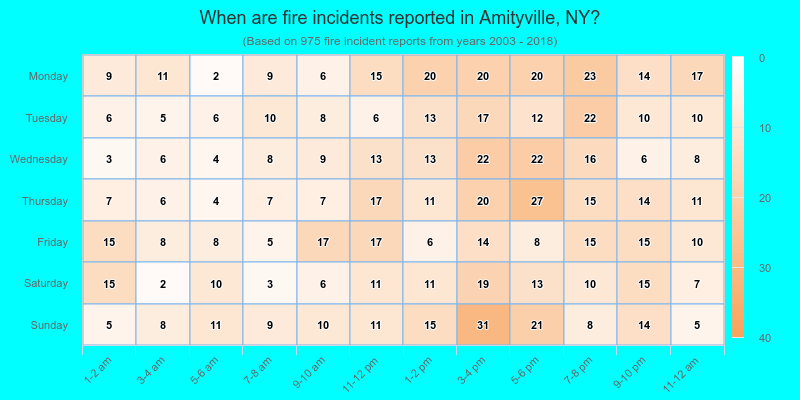
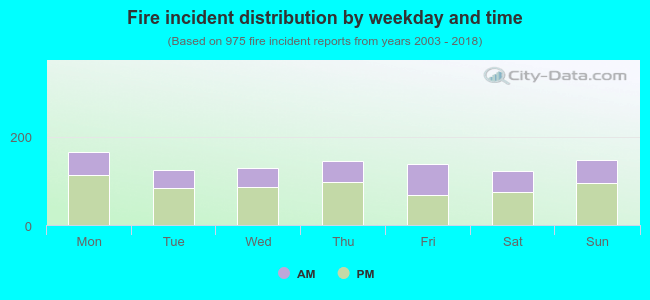 36.4% incidents where reported in the morning and 63.6% in the evening. The most fires (17.0%) took place on Monday, and the least (12.5%) on Saturday.
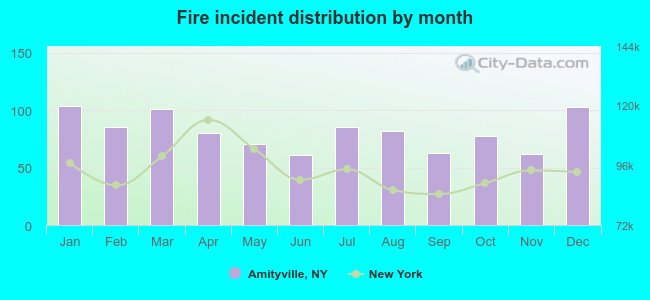 According to the 975 incident reports from years 2003 - 2018 most fires (10.7%) took place during January, and the least (6.3%) in June.
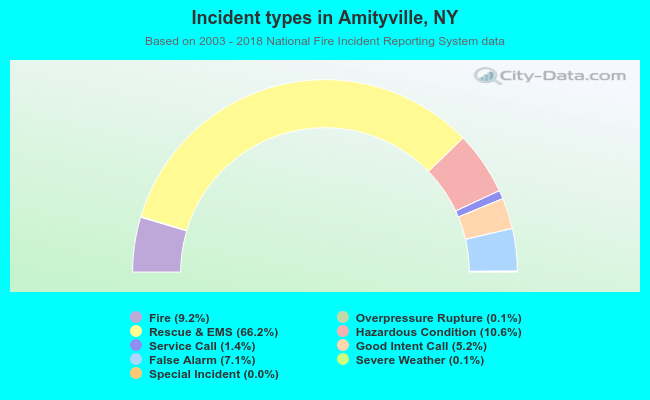 Out of all 10,586 cases reported during the years 2003 - 2018, the most belonged to the categories: Rescue & EMS (66.2%), Hazardous Condition (10.6%), and Fire (9.2%).
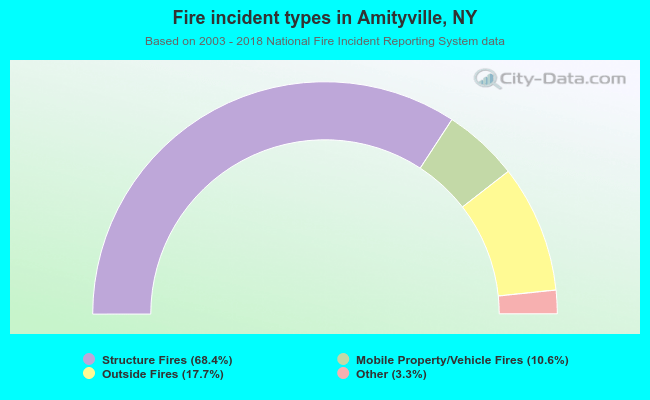 When looking into fire subcategories, the most reports belonged to: Structure Fires (68.4%), and Outside Fires (17.7%).