Massillon: Fire Incidents, Ohio (OH)
Where are fire incidents reported in Massillon, OH
Something went wrong! Please refresh the page.
| Fire incidents reported | |
|---|---|
| Sreet name | Count |
| LINCOLN WAY | 320 |
| LINCOLN WAY | 146 |
| ERIE | 96 |
| MASSILLON MARKETPLACE | 94 |
| TREMONT | 58 |
| ERIE AVE | 56 |
| GENOA AVE | 52 |
| 6TH | 50 |
| WALES | 50 |
| SOUTHWAY ST | 48 |
| WALNUT | 46 |
| 3RD | 44 |
| CHERRY | 44 |
| NAVARRE RD | 44 |
| 1ST | 40 |
| ERIE ST | 40 |
| HURON RD | 40 |
| TREMONT AVE | 40 |
| 17TH | 38 |
| 9TH | 38 |
| AMHERST | 38 |
| OBERLIN | 38 |
| 4TH | 36 |
| 8TH | 36 |
| 16TH | 34 |
| 1ST ST | 34 |
| 13TH | 32 |
| 21 HWY | 32 |
| NAVE | 32 |
| 3RD ST | 30 |
| Other | 1,247 |
2002 - 2018 National Fire Incident Reporting System (NFIRS) incidents
- Incident types reported to NFIRS in Massillon, OH
- 20,93259.6%Rescue & EMS
- 4,93714.1%Service Call
- 2,9738.5%Fire
- 2,8898.2%Hazardous Condition
- 1,7014.8%False Alarm
- 1,5854.5%Good Intent Call
- Fire incident types reported to NFIRS in Massillon, OH
- 1,34945.4%Structure Fires
- 1,11337.4%Outside Fires
- 43314.6%Mobile Property/Vehicle Fires
- 782.6%Other
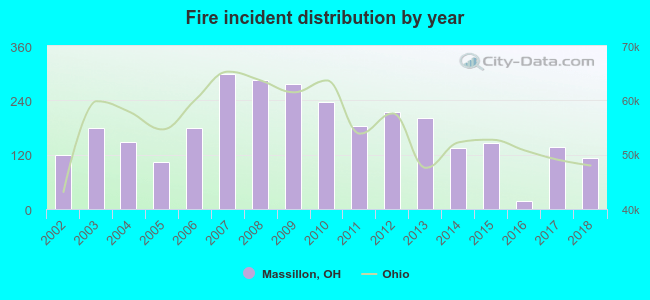 Based on the data from the years 2002 - 2018 the average number of fires per year is 175. The highest number of reported fire incidents - 299 took place in 2007, and the least - 18 in 2016. The data has a decreasing trend.
The average number of yearly fire incidents per 10k residents in Massillon, OH compared to nearest cities:
(Note: Based on data for the last 3 years, including only cities with population 5,000 and above)
| Massillon: | 27.6 |
| Canal Fulton: | 32.8 |
| Canton: | 54.2 |
| North Canton: | 32.2 |
| Green: | 0.6 |
| Orrville: | 74.5 |
| Louisville: | 68.5 |
| Barberton: | 18.0 |
| Norton: | 30.4 |
 The median response time based on all reported fire incidents is 5 minutes. This is lower compared to the Ohio median value.
The median response time in Massillon, OH compared to nearest cities:
(Note: Based on data for all years, including only cities with at least 500 fire incidents)
| Massillon: | 5 minutes |
| Navarre: | 10 minutes |
| Canal Fulton: | 8 minutes |
| Canton: | 5 minutes |
| North Canton: | 6 minutes |
| East Canton: | 10 minutes |
| Orrville: | 6 minutes |
| Uniontown: | 5 minutes |
| Louisville: | 8 minutes |
 According to the reports from the years 2002 - 2018 the average number of fire-related fatalities per year is 0. The highest number of reported deaths - 1 took place in 2002, and the lowest - 0 in 2003. The data has a dropping trend.
The average number of fatalities per 1,000 fires is 1. This indicator was the highest - 8 in 2002, and the lowest 0 in 2003. The trend for fatalities per 1,000 incidents is dropping. Compared to the Ohio value the number of fatalities per 1,000 fire incidents is much lower.
According to the reports from the years 2002 - 2018 the average number of fire-related fatalities per year is 0. The highest number of reported deaths - 1 took place in 2002, and the lowest - 0 in 2003. The data has a dropping trend.
The average number of fatalities per 1,000 fires is 1. This indicator was the highest - 8 in 2002, and the lowest 0 in 2003. The trend for fatalities per 1,000 incidents is dropping. Compared to the Ohio value the number of fatalities per 1,000 fire incidents is much lower.Deaths per 1,000 incidents in Massillon, OH compared to nearest cities:
(Note: Based on data for all years, including only cities with at least 2,500 fire incidents)
| Massillon: | 1.0 |
| Canton: | 2.4 |
| Akron: | 2.8 |
| Alliance: | 1.9 |
| Cuyahoga Falls: | 2.7 |
 According to the data from the years 2002 - 2018 the average number of fire-related casualties per year is 2. The highest number of reported casualties - 8 took place in 2010, and the lowest - 0 in 2002. The data has a constant trend.
The average number of injuries per 1,000 fires is 11. This indicator was the highest - 37 in 2014, and the lowest 0 in 2002. The trend for casualties per 1,000 fires is constant. Compared to the Ohio value the number of casualties per 1,000 fires is about the same.
According to the data from the years 2002 - 2018 the average number of fire-related casualties per year is 2. The highest number of reported casualties - 8 took place in 2010, and the lowest - 0 in 2002. The data has a constant trend.
The average number of injuries per 1,000 fires is 11. This indicator was the highest - 37 in 2014, and the lowest 0 in 2002. The trend for casualties per 1,000 fires is constant. Compared to the Ohio value the number of casualties per 1,000 fires is about the same.Casualties per 1,000 incidents in Massillon, OH compared to nearest cities:
(Note: Based on data for all years, including only cities with at least 500 fire incidents)
| Massillon: | 13.5 |
| Navarre: | 9.2 |
| Canal Fulton: | 5.5 |
| Canton: | 23.7 |
| North Canton: | 22.3 |
| East Canton: | 14.8 |
| Orrville: | 18.8 |
| Uniontown: | 15.0 |
| Louisville: | 9.4 |
 31.3% incidents where reported in the morning and 68.7% in the evening. The most fires (16.6%) took place on Sunday, and the least (12.5%) on Tuesday.
 Based on the 2,973 fire incidents from years 2002 - 2018 most fires (11.4%) took place during August, and the least (6.5%) in January.
 Out of all 35,092 cases reported during the years 2002 - 2018, the most belonged to the categories: Rescue & EMS (59.6%), Service Call (14.1%), and Fire (8.5%).
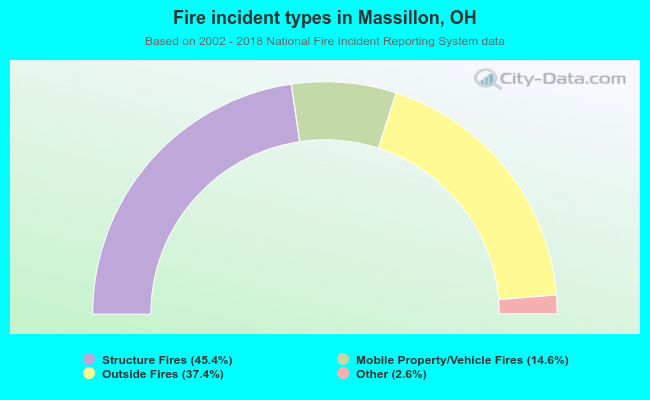 When looking into fire subcategories, the most incidents belonged to: Structure Fires (45.4%), and Outside Fires (37.4%).