Akron: Fire Incidents, Ohio (OH)
Where are fire incidents reported in Akron, OH
Something went wrong! Please refresh the page.
| Fire incidents reported | |
|---|---|
| Sreet name | Count |
| MARKET ST | 580 |
| MAIN ST | 542 |
| MANCHESTER RD | 448 |
| ARLINGTON ST | 384 |
| WATERLOO RD | 292 |
| EXCHANGE ST | 286 |
| BRITTAIN RD | 266 |
| KENMORE BLVD | 204 |
| COPLEY RD | 192 |
| CANTON RD | 170 |
| VERNON ODOM BLVD | 158 |
| ARLINGTON RD | 156 |
| BROWN ST | 154 |
| DIAGONAL RD | 142 |
| EVERTON DR | 138 |
| ROMIG RD | 138 |
| WILBETH RD | 138 |
| GRANT ST | 136 |
| MEDINA RD | 136 |
| HOWARD ST | 134 |
| PORTAGE PATH | 122 |
| CROSIER ST | 110 |
| SHERMAN ST | 106 |
| I 77 | 100 |
| TURKEYFOOT LAKE RD | 100 |
| BROADWAY ST | 96 |
| LOCUST ST | 96 |
| CALLIS DR | 94 |
| KLING ST | 92 |
| SUMNER ST | 92 |
| Other | 9,095 |
2002 - 2018 National Fire Incident Reporting System (NFIRS) incidents
- Incident types reported to NFIRS in Akron, OH
- 28,13033.4%Rescue & EMS
- 14,89717.7%Fire
- 14,04216.7%Hazardous Condition
- 12,65115.0%Service Call
- 7,3208.7%Good Intent Call
- 5,9617.1%False Alarm
- 1,1471.4%Severe Weather
- 1010.1%Overpressure Rupture
- Fire incident types reported to NFIRS in Akron, OH
- 7,40549.7%Structure Fires
- 4,42229.7%Outside Fires
- 3,00420.2%Mobile Property/Vehicle Fires
- 660.4%Other
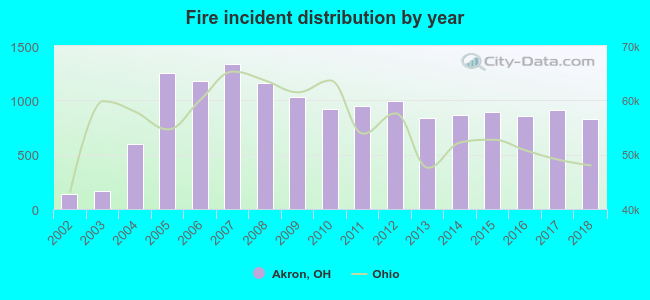 Based on the data from the years 2002 - 2018 the average number of fire incidents per year is 876. The highest number of fires - 1,334 took place in 2007, and the least - 139 in 2002. The data has an increasing trend.
The average number of yearly fire incidents per 10k residents in Akron, OH compared to nearest cities:
(Note: Based on data for the last 3 years, including only cities with population 5,000 and above)
| Akron: | 43.8 |
| Cuyahoga Falls: | 24.9 |
| Tallmadge: | 28.1 |
| Barberton: | 18.0 |
| Munroe Falls: | 12.6 |
| Fairlawn: | 48.5 |
| Norton: | 30.4 |
| Green: | 0.6 |
| Stow: | 18.6 |
 The median response time based on all reported fire incidents is 5 minutes. This is lower than the state median value.
The median response time in Akron, OH compared to nearest cities:
(Note: Based on data for all years, including only cities with at least 500 fire incidents)
| Akron: | 5 minutes |
| Cuyahoga Falls: | 4 minutes |
| Tallmadge: | 5 minutes |
| Barberton: | 4 minutes |
| Mogadore: | 6 minutes |
| Fairlawn: | 4 minutes |
| Norton: | 7 minutes |
| Stow: | 5 minutes |
| Uniontown: | 5 minutes |
 Based on the data from the years 2002 - 2018 the average number of fire-related fatalities per year is 2. The highest number of deaths - 5 took place in 2005, and the lowest - 0 in 2002. The data has a growing trend.
The average number of fatalities per 1,000 fire incidents is 2. This indicator was the highest - 5 in 2017, and the lowest 0 in 2002. The trend for deaths per 1,000 incidents is growing. Compared to the state value the number of fatalities per 1,000 fires is higher.
Based on the data from the years 2002 - 2018 the average number of fire-related fatalities per year is 2. The highest number of deaths - 5 took place in 2005, and the lowest - 0 in 2002. The data has a growing trend.
The average number of fatalities per 1,000 fire incidents is 2. This indicator was the highest - 5 in 2017, and the lowest 0 in 2002. The trend for deaths per 1,000 incidents is growing. Compared to the state value the number of fatalities per 1,000 fires is higher.
 According to the data from the years 2002 - 2018 the average number of fire-related yearly casualties is 31. The highest number of casualties - 55 took place in 2009, and the lowest - 3 in 2002. The data has a growing trend.
The average number of injuries per 1,000 fire incidents is 34. This indicator was the highest - 59 in 2004, and the lowest 14 in 2017. The trend for injuries per 1,000 incidents is dropping. Compared to the Ohio value the number of injuries per 1,000 fires is much higher.
According to the data from the years 2002 - 2018 the average number of fire-related yearly casualties is 31. The highest number of casualties - 55 took place in 2009, and the lowest - 3 in 2002. The data has a growing trend.
The average number of injuries per 1,000 fire incidents is 34. This indicator was the highest - 59 in 2004, and the lowest 14 in 2017. The trend for injuries per 1,000 incidents is dropping. Compared to the Ohio value the number of injuries per 1,000 fires is much higher.
 35.0% incidents where reported in the morning and 65.0% in the evening. The most fires (15.3%) took place on Sunday, and the least (13.6%) on Wednesday.
 Based on the 14,897 incident reports from years 2002 - 2018 most fires (10.6%) took place during July, and the least (5.6%) in February.
 Out of all 84,295 cases reported during the years 2002 - 2018, the most belonged to the categories: Rescue & EMS (33.4%), Fire (17.7%), and Hazardous Condition (16.7%).
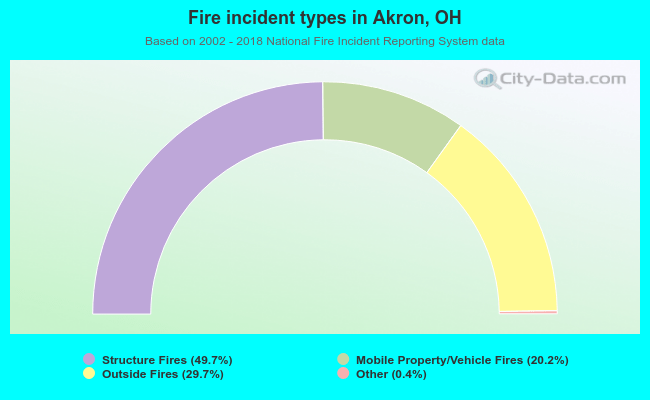 When looking into fire subcategories, the most incidents belonged to: Structure Fires (49.7%), and Outside Fires (29.7%).