McKenzie: Fire Incidents, Tennessee (TN)
Where are fire incidents reported in McKenzie, TN
Something went wrong! Please refresh the page.
|
| |||||||||||||||||||||||||||||||||||||||||||||||||||||||||||||||||||||||||||||||||||||||||||||||||||||||||||||
2004 - 2018 National Fire Incident Reporting System (NFIRS) incidents
- Incident types reported to NFIRS in McKenzie, TN
- 74631.6%Fire
- 51721.9%Hazardous Condition
- 41717.7%False Alarm
- 27011.4%Good Intent Call
- 26711.3%Rescue & EMS
- 1385.8%Service Call
- 50.2%Severe Weather
- Fire incident types reported to NFIRS in McKenzie, TN
- 34746.5%Structure Fires
- 27436.7%Outside Fires
- 11415.3%Mobile Property/Vehicle Fires
- 111.5%Other
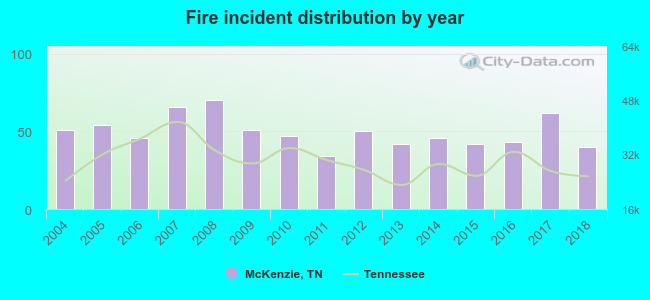 According to the data from the years 2004 - 2018 the average number of fires per year is 50. The highest number of fires - 70 took place in 2008, and the least - 34 in 2011. The data has a decreasing trend.
The average number of yearly fire incidents per 10k residents in McKenzie, TN compared to nearest cities:
(Note: Based on data for the last 3 years, including only cities with population 5,000 and above)
| McKenzie: | 88.5 |
| Paris: | 83.4 |
| Milan: | 106.8 |
| Martin: | 58.9 |
| Humboldt: | 67.1 |
| Lexington: | 127.8 |
| Union City: | 103.1 |
| Luray: | 9.1 |
| Jackson: | 58.8 |
 The median response time based on all reported fire incidents is 6 minutes. This is similar to the state median value.
The median response time in McKenzie, TN compared to nearest cities:
(Note: Based on data for all years, including only cities with at least 500 fire incidents)
| McKenzie: | 6 minutes |
| Huntingdon: | 7 minutes |
| Dresden: | 5 minutes |
| Paris: | 5 minutes |
| Milan: | 6 minutes |
| Martin: | 5 minutes |
| Camden: | 8 minutes |
| Trenton: | 6 minutes |
| Humboldt: | 4 minutes |
 33.9% incidents where reported in the morning and 66.1% in the evening. The most fires (16.2%) took place on Friday, and the least (10.9%) on Tuesday.
 Based on the 746 incident reports from years 2004 - 2018 most fires (11.0%) took place during January, and the least (6.0%) in April.
 Out of all 2,360 cases reported during the years 2004 - 2018, the most belonged to the categories: Fire (31.6%), Rescue & EMS (21.9%), and Good Intent Call (17.7%).
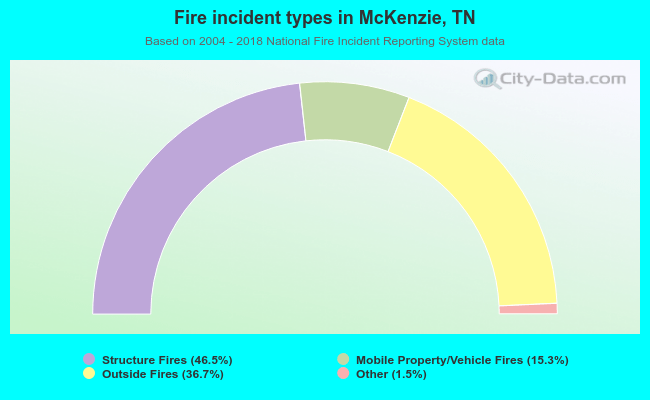 When looking into fire subcategories, the most reports belonged to: Structure Fires (46.5%), and Outside Fires (36.7%).